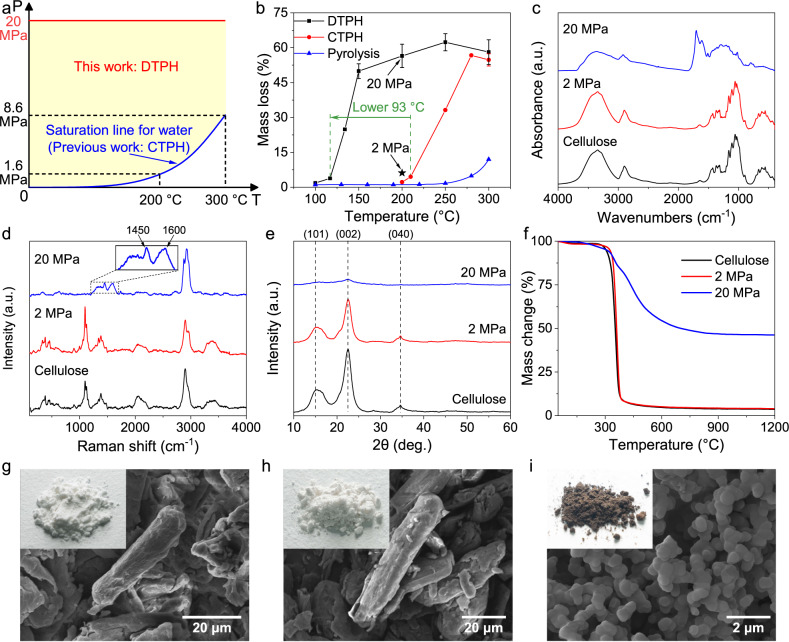
Fig. 2. Production of carbon sub-micron spheres from cellulose in the DTPH reaction.
a Schematic of obtainable reaction parameters in the DTPH and CTPH process. b Mass loss of cellulose in the DTPH process, the CTPH process, and the conventional pyrolysis process. The reaction pressure of the DTPH process was 20 MPa. Pentagram: Mass loss in the DTPH process under 2 MPa. Error bars represent standard deviations of repeated tests. c–f Comparison of the structures of cellulose, hydrothermally treated cellulose from 200 °C under 2 MPa, and hydrothermally treated cellulose from 200 °C under 20 MPa. c FTIR spectra. d Raman spectra. e XRD patterns. f Pyrolysis behavior in TGA. SEM of original cellulose (g), hydrothermally treated cellulose from 200 °C under 2 MPa (h), and hydrothermally treated cellulose from 200 °C under 20 MPa (i). Insets: macroscopic morphologies.

