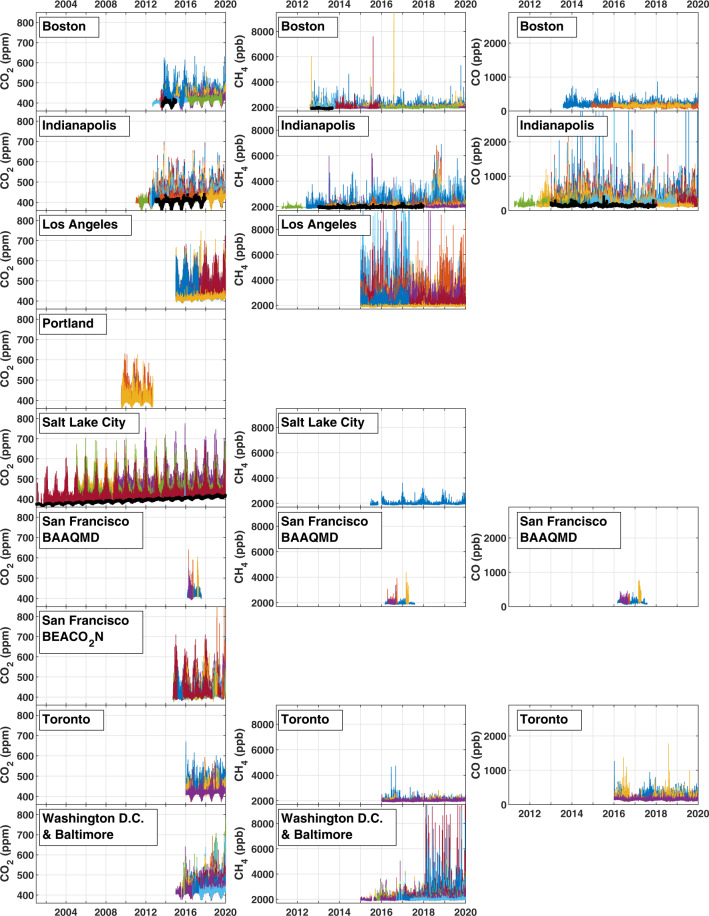
Fig. 2.
Time series of the CO2-USA data synthesis data set. The columns show CO2 (left), CH4 (middle), and CO (right) while the rows show the CO2-USA cities in alphabetical order. Each colored line represents an inlet at a site while the thicker black lines are the background mole fractions (shown for species/cities where a published background is available). BAAQMD: Bay Area Air Quality Management District. BEACO2N: Berkeley Environmental Air-quality & CO2 Network.

