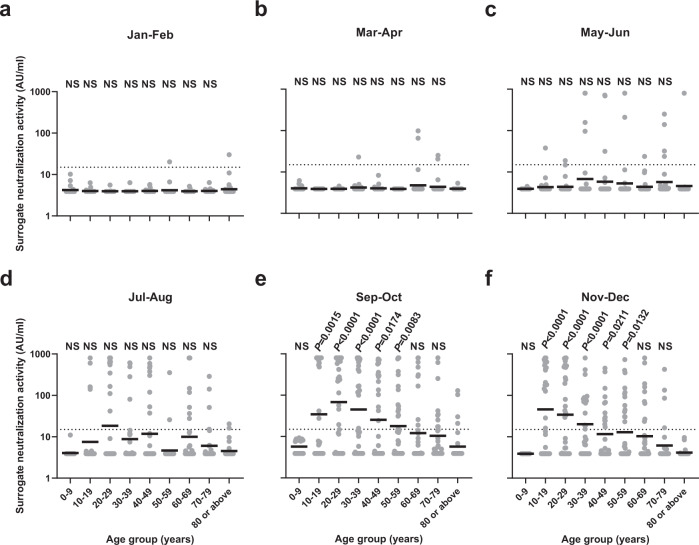
Fig. 3. Comparison of surrogate neutralization activity among different age groups.
a–f Surrogate neutralization activity in different time periods. The horizontal bar indicates the geometric mean level. Dotted horizontal lines represent the manufacturer’s seropositivity cutoff level (15 AU/ml). The geometric mean antibody titer for each age group was compared to the ≥80 years age group using the one way ANOVA with Dunn’s multiple comparisons test. The number of serum specimens tested in each period is shown in Supplementary Table S1. Source data are provided as a Source Data file. NS, not significant.

