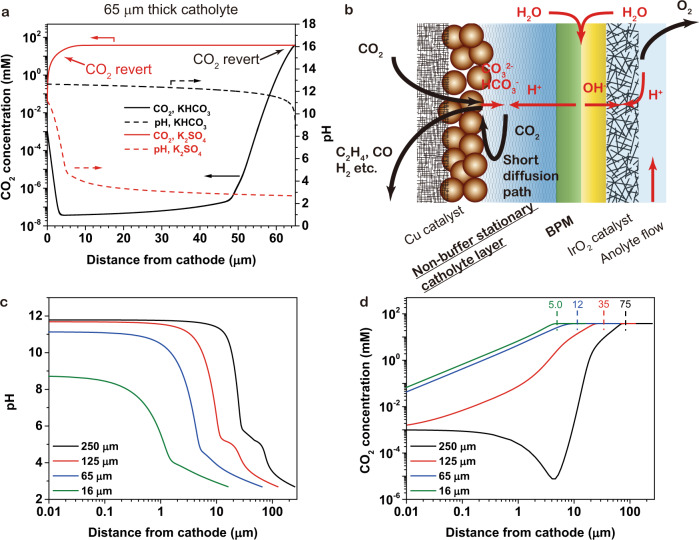
Fig. 1. The configuration and simulation of the electrolyzer design.
a The CO2 (solid lines) and pH distributions (dashed lines) in the 65 μm-thick SC-layer. The positions where the (bi)carbonates revert to CO2 are marked (red for non-buffering and black for buffering electrolyte). b The schemes and the mass transfer in the SC-BPMEA. c The pH distribution inside the SC-layer. d The dissolved CO2 concentration profile inside the SC-layer. The virtual boundaries marked by dash lines are defined as the position where the CO2 concentration becomes 1% lower than the bulk concentration. The numbers marked above are the distances between the virtual boundaries and the cathode surface.

