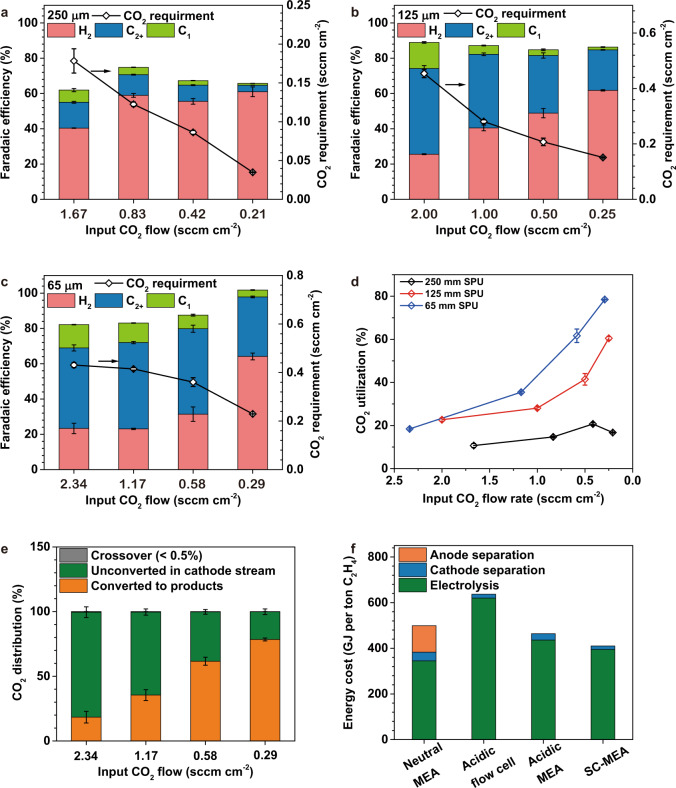
Fig. 4. The exploration of the CO2RR performance and energy intensity of SC-BPMEA with restricted reactant availability.
All the measurements were conducted at 35 °C and 200 mA cm−2, and the data were collected after 2 h of continuous operation. a–c The FE distributions and the CO2 requirements (total CO2 converted to products) of the SC-BPMEAs with different catholyte thickness and input CO2 flow rates (sccm normalized by electrode area). C1 refers to CO, formate, and methane. C2+ refers to ethylene, ethanol, acetate, and n-propanol. d The total CO2 single-pass utilization (the CO2-to-ethylene single-pass conversion see Supplementary Fig. 13a) for the SC-BPMEAs with different catholyte thickness and input CO2 flow rates. e Carbon balance in SC-BPMEA with 65 μm 0.5 M K2SO4 at different input CO2 flow rates. See Supplementary Fig. 13b for plots on a logarithmic scale. f The comparison of the energy cost distributions among state-of-art CO2-to-ethylene electrolyzers. The SC-BPMEA case refers to the input CO2 flow rate of 1.17 sccm cm−2. The error bars represent the standard deviation of three measurements.

