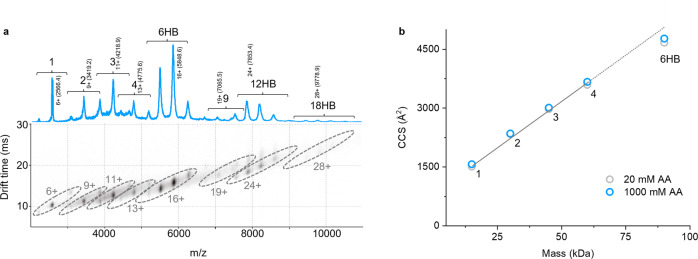
Fig. 3. Ion mobility-mass spectrometry (IM-MS) analysis of nanostructure assembly at 300 mM AmAc.
Experimental parameters: sampling cone 125 V, trap collision energy 25 V, trap DC bias 50 V, trap pressure 4.38 × 10⁻² mbar, and backing pressure 5.88 mbar. a Top panel: native ESI-MS showing oligomers up to 18-mer (18HB). Bottom panel: corresponding drift time plot with different charge states (selected peaks annotated) of the same oligomer size grouped into ellipses. b Collision cross sections (CCS) derived from the measured IM drift times for different oligomer sizes after calibration, using the charge state with the highest peak intensity per group: (monomer (1) 6+, dimer (2) 9+, trimer (3) 11+, tetramer (4) 13+ and (6HB) 16+), at AmAc concentrations of 20 and 1000 mM. Monomer (1) to tetramer (4) shows a near-linear size increase, whilst the hexamer (6HB) is below the linear trend line (dotted), and therefore more compact. Note that the pentamer (5) was not detected.

