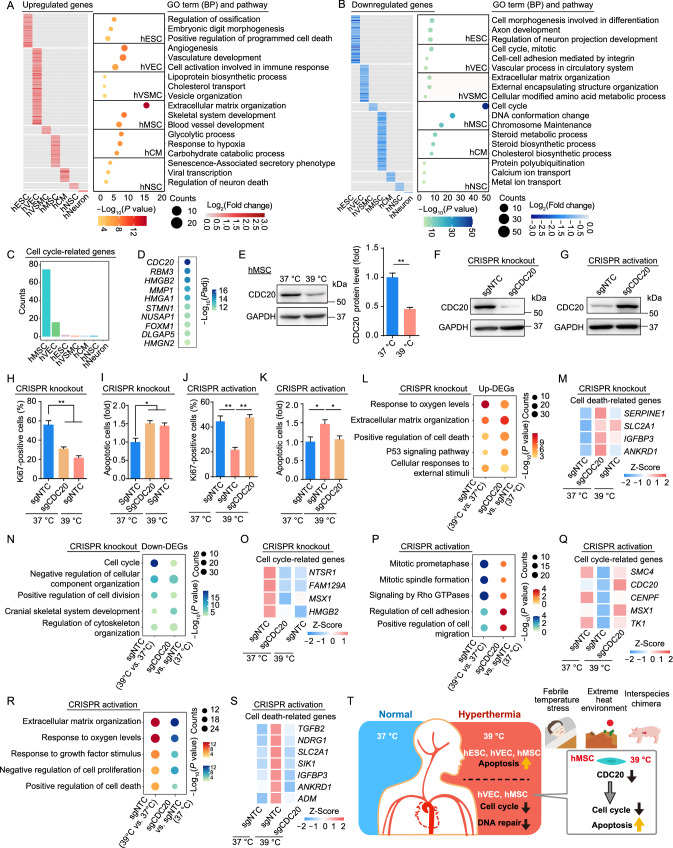
Figure 2.
Cell type-specific transcriptional signatures highlight the impaired cell proliferation of hMSCs upon heat stress shock. (A and B) Heatmaps showing the relative transcriptional changes for cell type-specific upregulated (A) and downregulated (B) hyperthermia DEGs in seven cell types. Representative Gene Ontology (GO) terms for each set of DEGs are shown to the right. (C) Bar plot showing the counts of cell type-specific hyperthermia DEGs related to cell cycle. (D) Dot plot showing the top ten significantly downregulated genes of hyperthermia DEGs in hMSCs. (E) Left, western blot analysis showing the expression of CDC20 in hMSCs under control (37 °C) and febrile temperature (39 °C) culture conditions. GAPDH was used as loading control. Right, relative protein level of CDC20 was calculated and is shown as the mean ± SEM, n = 3, **P < 0.01. (F and G) Western blot analysis of CDC20 protein in hMSCs transduced with sgNTC or CDC20-targeting knockout sgRNA (F) or CDC20-targeting activation sgRNA (G). GAPDH was used as the loading control. (H) Immunofluorescence analysis of Ki67 in hMSCs transduced with sgNTC or CDC20-targeting knockout sgRNA under control (37 °C) and febrile temperature (39 °C) culture conditions. Data are presented as the mean ± SEMs, n = 3. **P < 0.01. (I) Flow cytometric analysis of apoptosis in hMSCs transduced with sgNTC or CDC20-targeting knockout sgRNA under control (37 °C) and febrile temperature (39 °C) culture conditions. Data are presented as the mean ± SEMs, n = 3. *P < 0.05. (J) Immunofluorescence analysis of Ki67 in hMSCs transduced with sgNTC or CDC20-targeting activation sgRNA under control (37 °C) and febrile temperature (39 °C) culture conditions. Data are presented as the mean ± SEMs, n = 3. **P < 0.01. (K) Flow cytometric analysis of apoptosis in hMSCs transduced with sgNTC or CDC20-targeting activation sgRNA under control (37 °C) and febrile temperature (39 °C) culture conditions. Data are presented as the mean ± SEMs, n = 6. *P < 0.05. (L) Representative shared GO terms enriched for the upregulated hyperthermia DEGs and upregulated DEGs upon knockdown of CDC20 in hMSCs. (M) Heatmap showing the similar expression changes of cell death-related genes upon heat stress shock and knockdown of CDC20 in hMSCs. (N) Representative shared GO terms enriched for the downregulated hyperthermia DEGs and downregulated DEGs upon CDC20 knockdown. (O) Heatmap showing the similar expression changes of cell cycle-related genes upon heat stress shock and knockdown of CDC20 in hMSCs. (P) Representative rescued GO terms enriched for the downregulated hyperthermia DEGs and upregulated DEGs upon activation of CDC20 in hMSCs. (Q) Heatmap showing the expression of cell cycle-related genes that were downregulated by heat stress shock but rescued by activation of CDC20 in hMSCs. (R) Representative rescued GO terms enriched for the upregulated hyperthermia DEGs and downregulated DEGs upon activation of CDC20 in hMSCs. (S) Heatmap showing the expression of cell death-related genes that were upregulated by heat stress shock but rescued upon the activation of CDC20 in hMSCs. (T) A schematic illustration showing the phenotypic and transcriptomic characteristics of diverse human stem cells and their derivatives upon 39 °C heat stress shock

