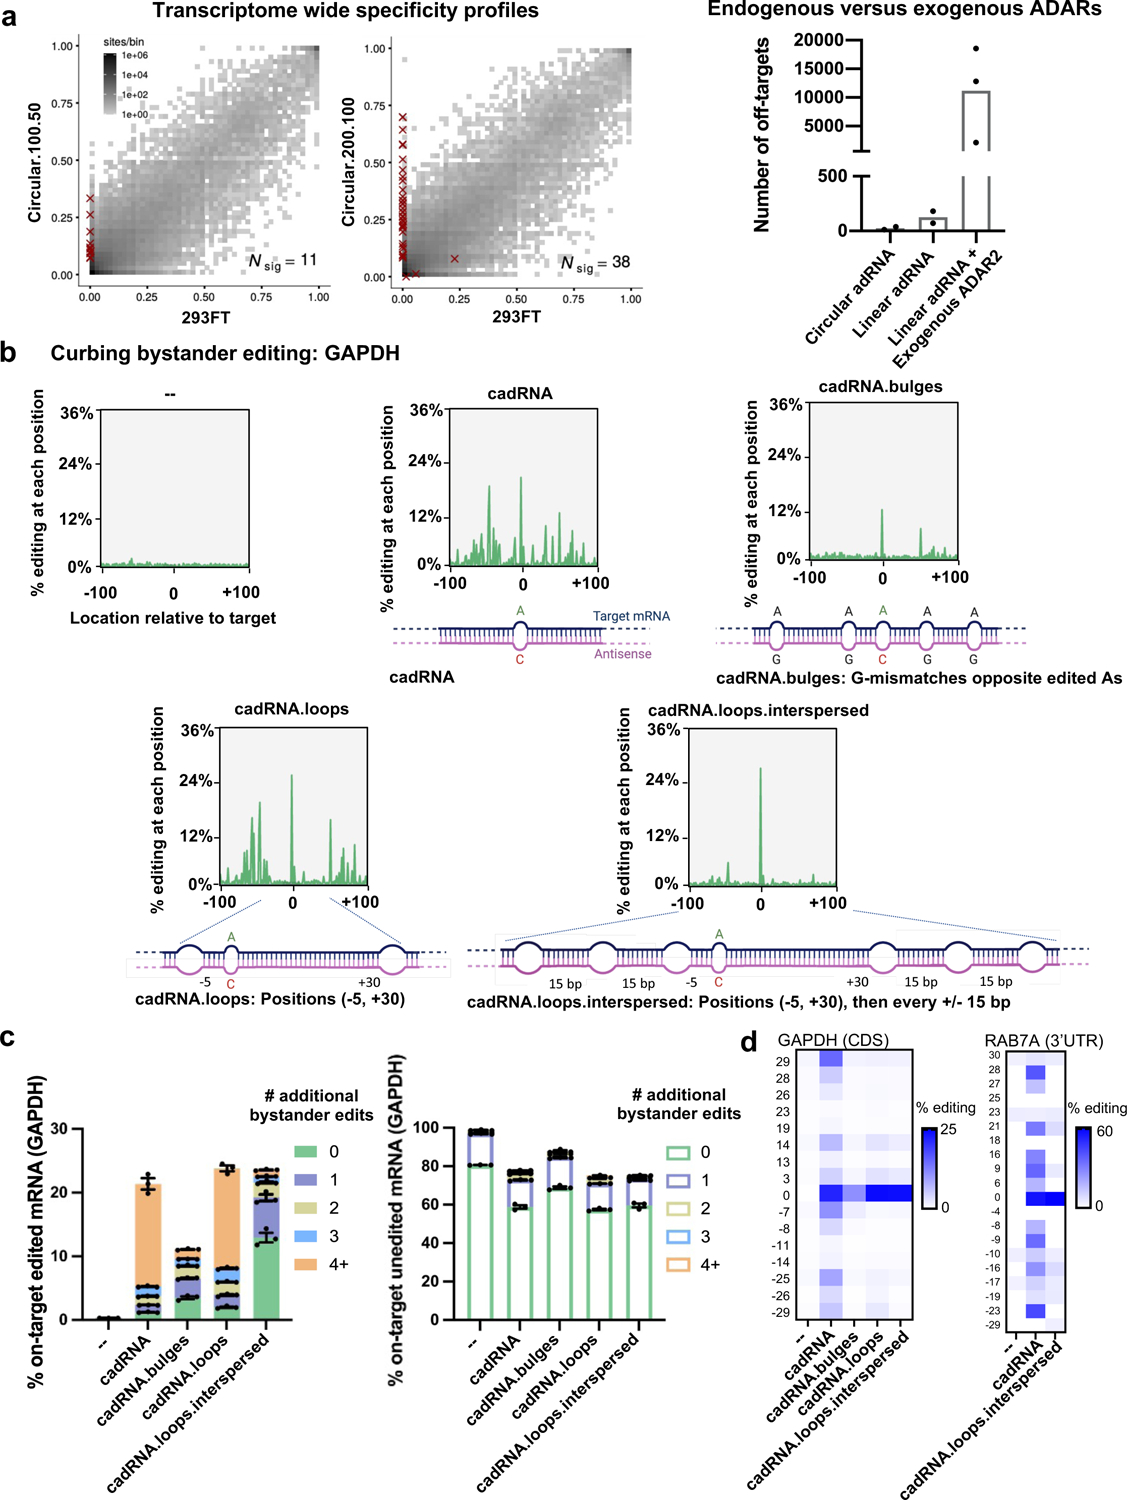
Figure 2: Transcriptome-wide and target transcript-level specificity profiles of cadRNAs.

(a) (left-panel) 2D histograms comparing the transcriptome-wide A-to-G editing yields observed with a cadRNA construct (y-axis) to the yields observed with the control sample (x-axis). Each histogram represents the same set of reference sites, where read coverage was at least 10 and at least one putative editing event was detected in at least one sample. Nsig is the number of sites with significant changes in editing yield. Points corresponding to such sites are shown with red crosses. The on-target editing values obtained via Sanger sequencing for the samples are HEK293FT: 0%, circular.100.50: 40.47% and circular.200.100: 43.54% respectively. (right-panel) A comparison of the number of off-targets induced by delivery of circular adRNAs, linear adRNAs, and linear adRNAs with co-delivered ADAR220. (b) Engineered cadRNA designs for reducing bystander editing. Design 1 (cadRNA): Unmodified circular.200.100 antisense. Design 2 (cadRNA.bulges): Antisense bulges created by positioning guanosines opposite bystander edited adenosines. Design 3 (cadRNA.loops): Loops of size 8 bp created at position −5 and +30 relative to the target adenosine. Design 4 (cadRNA.loops.interspersed): Loops of size 8 bp created at position −5 and +30 relative to the target adenosine and additional 8 bp loops added at 15 bp intervals all along the antisense strand. Plots depicting the location and extent of all substitutions in the 200 bp dsRNA stretch (n=1 representative plot shown for each construct, analyzed via CRISPResso236). (c) Plots depict % of on-target edited or unedited reads with and without further A-to-G hyperedits in the 200 bp dsRNA stretch formed between the cadRNA and target RNA as observed with the various designs. Substitutions other than A-to-G were not considered for this analysis. Values represent mean % +/− SEM on-target editing in 200 bp long amplicons as quantified by NGS (n=3). (d) Heatmaps of percent editing within a 60 bp window around the target adenosine in the GAPDH and RAB7A transcripts. The positions of adenosines relative to the target adenosine (0) are listed to the left of the heatmap. Values represent mean (n=2). All experiments were carried out in HEK293FT cells.
