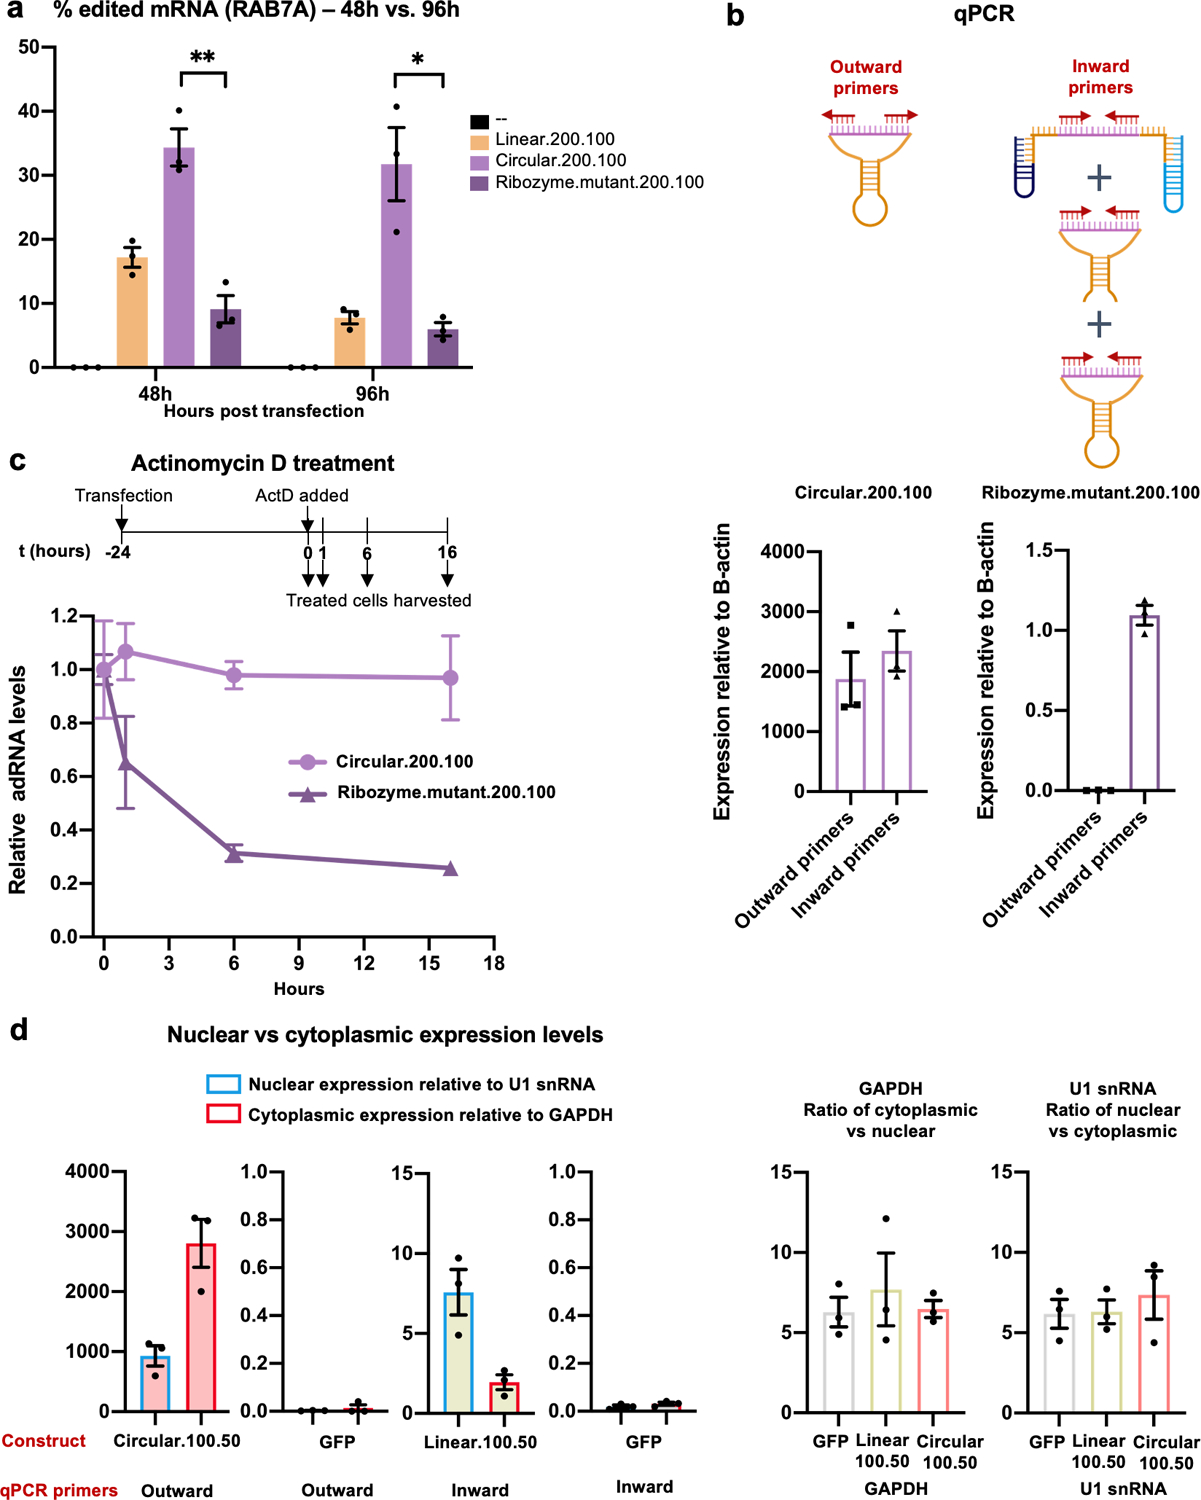
Extended Data Fig. 1. Characterization of genetically encoded cadRNAs.

(a) RNA editing efficiencies achieved 48 hours and 96 hours post transfection of circular.200.100 and ribozyme.mutant.200.100 plasmids. Ribozyme.mutant.200.100 was created by substituting two key residues in both twister ribozymes (P3 ribozyme: residue 15 G to U and residue 16 U to G; P1 ribozyme: residue 22 A to G and residue 26 C to U) of the construct circular.200.10037,38. Values represent mean +/− SEM (n=3; p=0.0021, p=0.0112; unpaired t-test, two-tailed). (b) Schematic representation of various products detected by inward and outward binding primers used for quantification. The outward binding primers selectively amplify the cadRNA. The inward binding primers amplify uncleaved and cleaved-unligated fractions in addition to cadRNA. Values represent mean +/− SEM (n=3). (c) Cells transfected with circular.200.100 and ribozyme.mutant.200.100 plasmids were treated with actinomycin D for 1, 6 and 16 hours starting at 24 hours post transfections. qPCRs were carried out using inward binding primers from panel (b) and expression levels were normalized to untreated samples. (d) Levels of circular.100.50 and linear.100.50 adRNA were measured in the nucleus and cytoplasm. GFP transfected cells were included as controls. U1 snRNA and GAPDH were used to normalize for the nuclear and cytoplasmic compartments respectively. Relative U1 snRNA and GAPDH levels seen in the nuclear vs cytoplasmic fractions were consistent with other published work39. Values represent mean +/− SEM (n=3). All experiments were carried out in HEK293FT cells.
