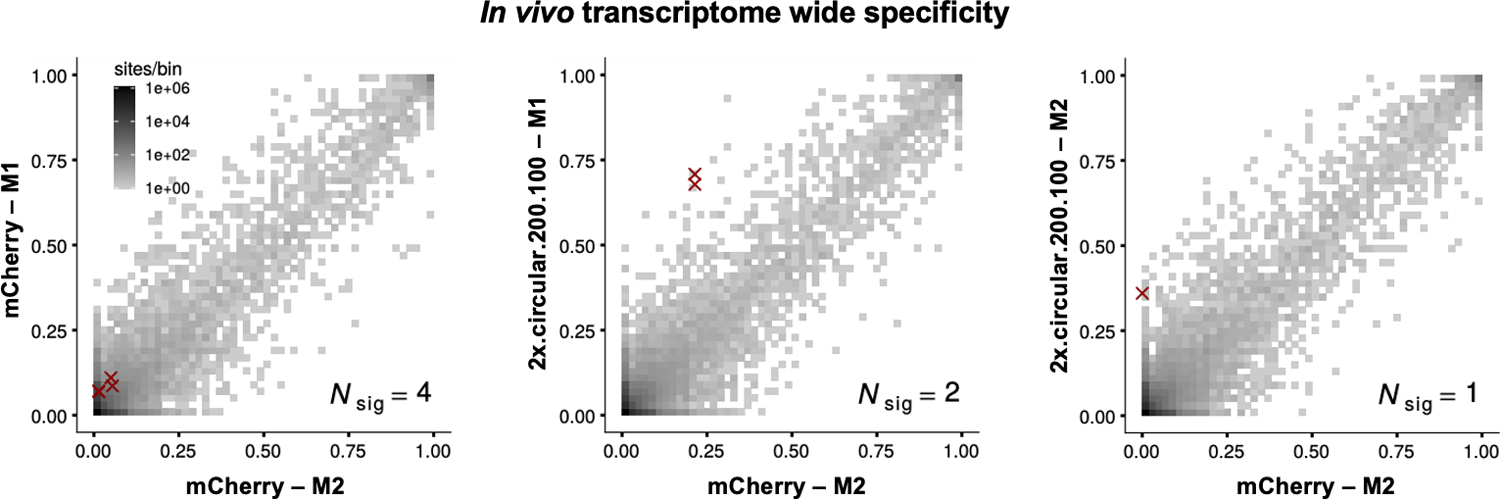
Extended Data Fig. 4. In vivo specificity of cadRNAs.

2D histograms comparing the transcriptome-wide A-to-G editing yields observed with an AAV delivered construct (y-axis) to the yields observed with the control AAV construct (x-axis). Each histogram represents the same set of reference sites, where read coverage was at least 10 and at least one putative editing event was detected in at least one sample. Nsig is the number of sites with significant changes in editing yield. Points corresponding to such sites are shown with red crosses. The on-target editing efficiency values obtained in the RNA seq are highly inflated due to a large number of reads coming from the cadRNAs mapping onto the target and thus have been omitted from the 2D histograms. The on-target editing values obtained via Sanger sequencing for the four samples analyzed by RNA seq were mCherry-M1: 0%, mCherry-M2: 0%, 2x.circular.200.100-M1: 42.94% and 2x.circular.200.100-M2: 41.32% respectively. M1 and M2 refer to injected mouse 1 and 2.
