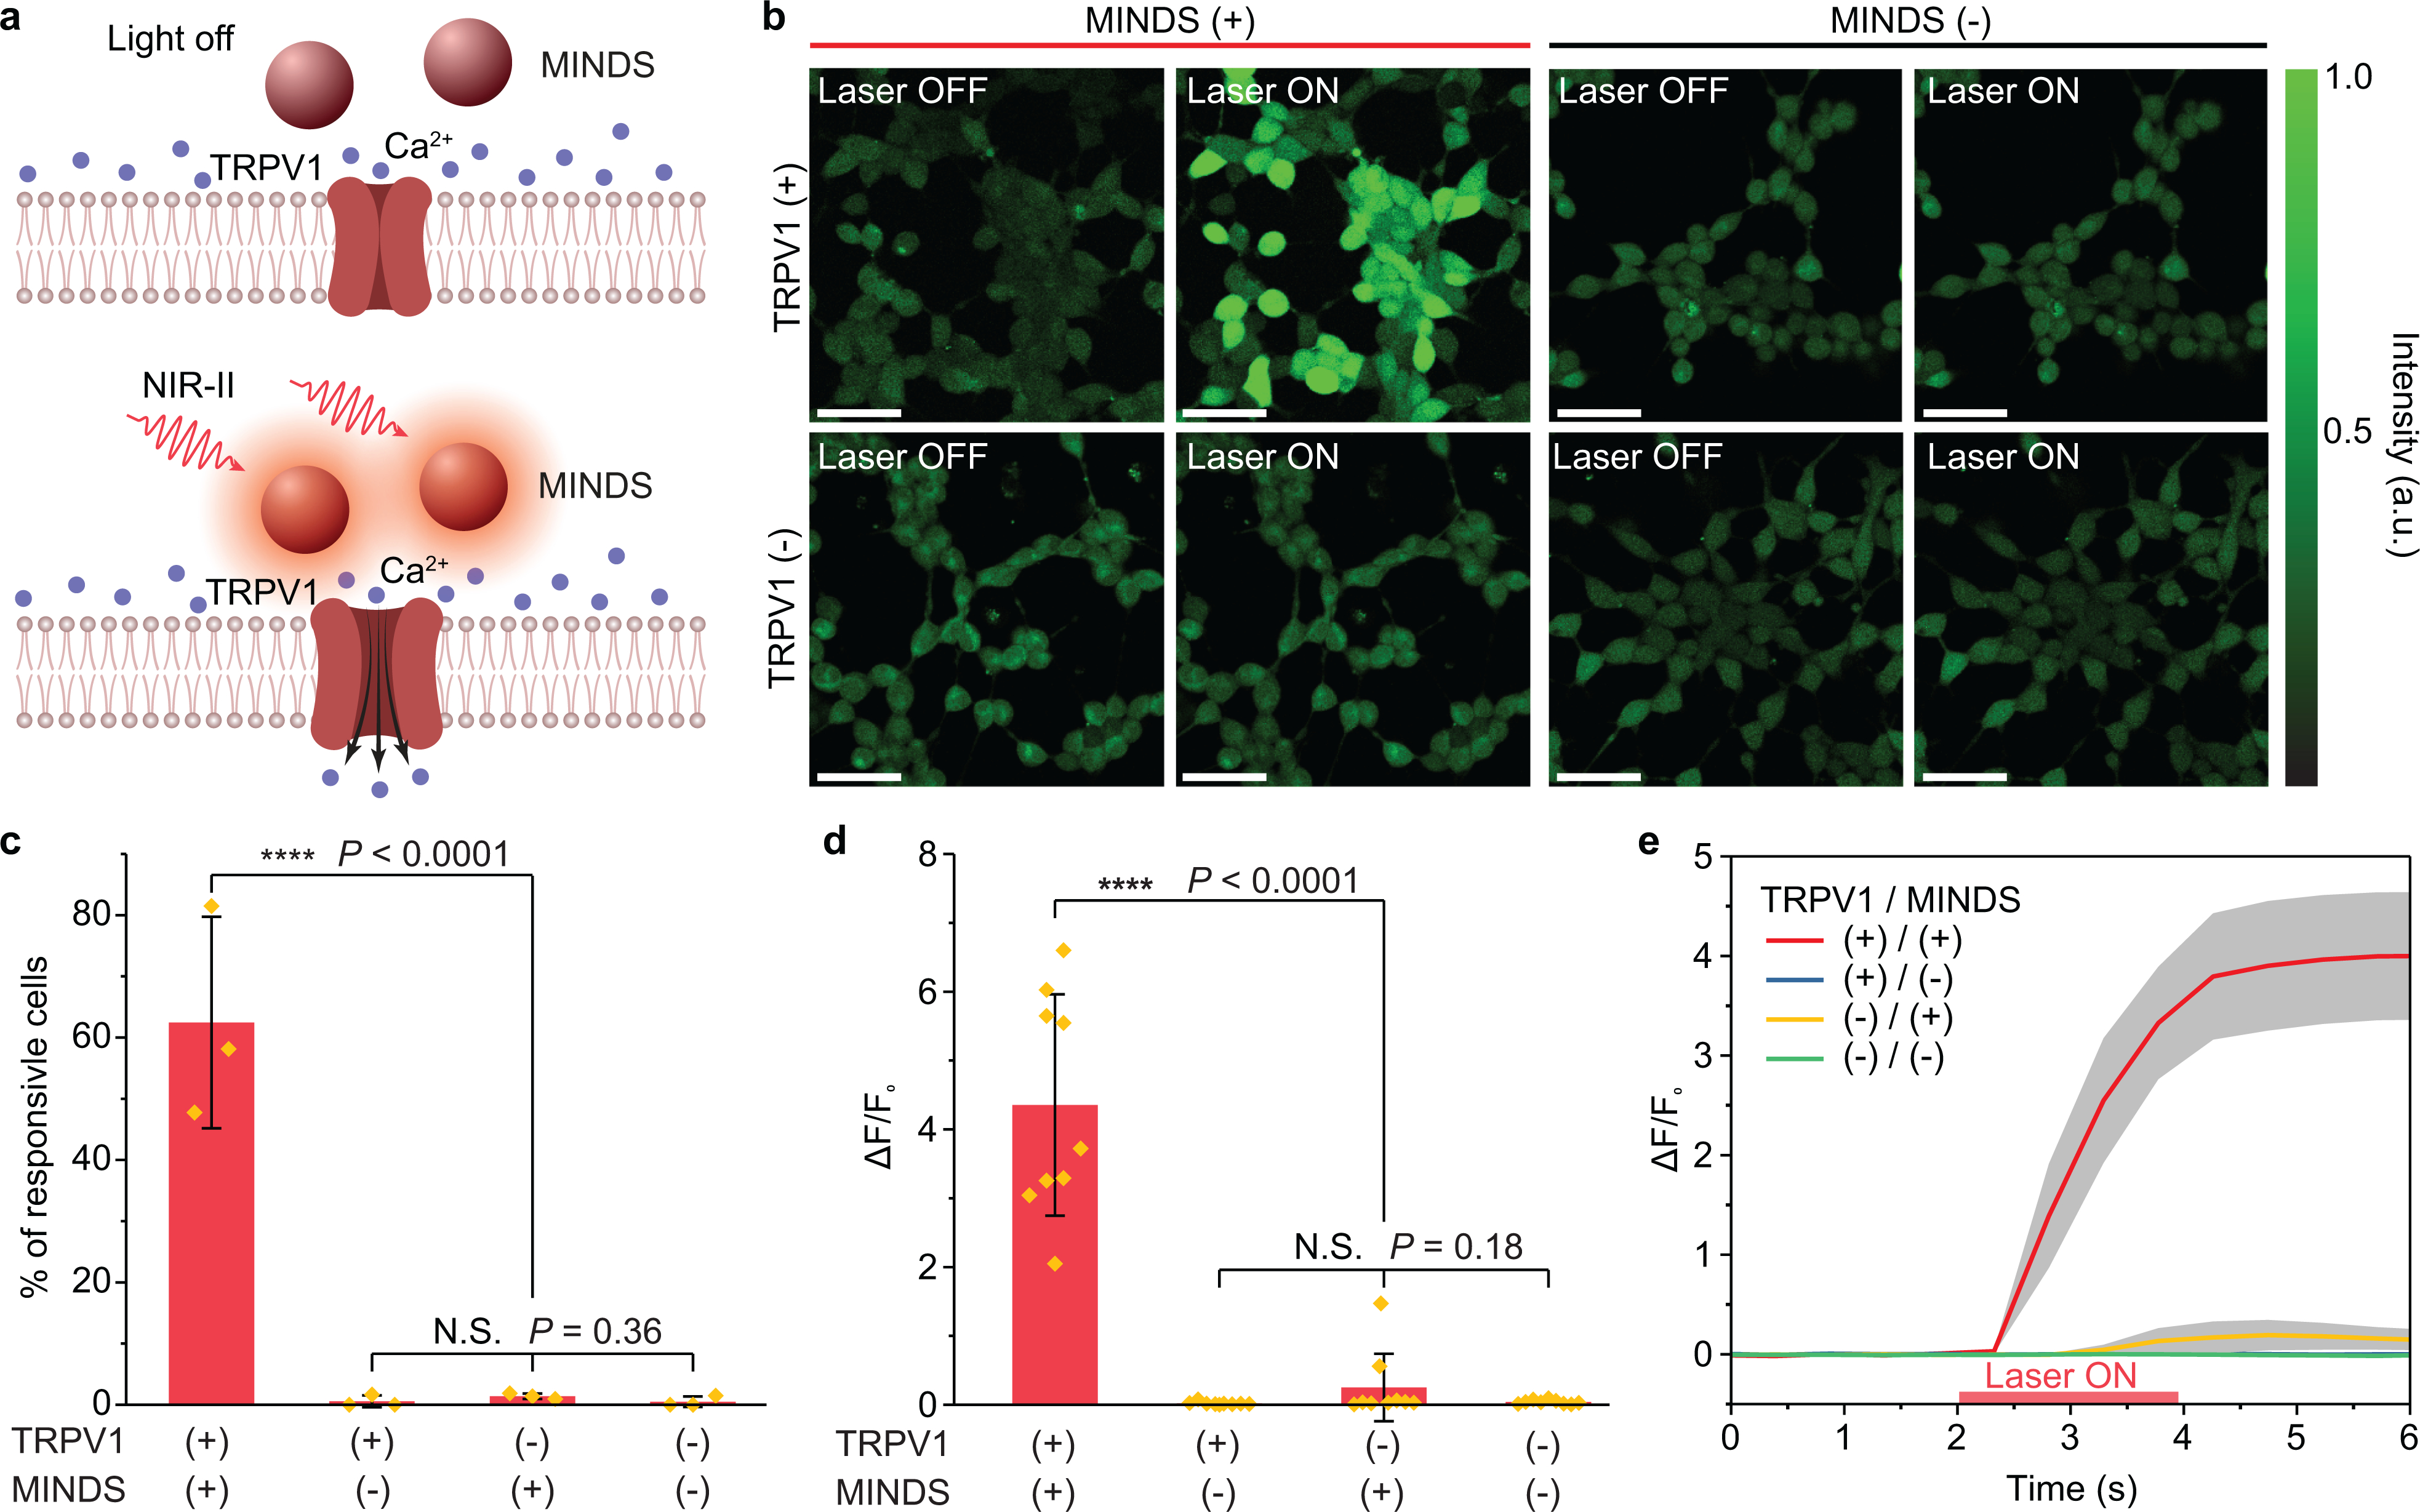
Fig. 2 |. NIR-II photothermal activation of MINDS-sensitized TRPV1 in vitro.

a, Schematic showing NIR-II photothermal activation of TRPV1 expressed in the plasma membrane of cells mediated by MINDS. b, Calcium imaging of HEK293T cells under different experimental conditions. A calcium signal increase is only seen when the NIR-II laser illuminates TRPV1+/MINDS+ cells. The experiment was repeated three times independently with similar results. Scale bars represent 50 μm. c, Percentage of responsive cells upon NIR-II illumination. A cell is defined responsive if its calcium signal rises over 50% of original intensity within 5 s of NIR-II illumination (i.e., ΔF/F0> 50%)25. (n = 3 independent experiments for each group, including 874 cells in total; one-way analysis of variance (ANOVA), F(3,8) = 38, P < 0.0001; F(2,6) = 1.23, P = 0.36). Data are presented as mean values +/− SD. d, Statistical analysis of calcium signal changes for different groups of cells (n = 9 replicates with 15 cells in each replicate), shown as the ratio of maximum calcium signal change after NIR-II illumination over the original calcium signal before NIR-II illumination. (One-way ANOVA, F(3,32) = 40.74, P < 0.0001; F(2,24) = 1.82, P = 0.18). Data are presented as mean values +/− SD. e, Temporal dynamics of the calcium signal for different groups of cells, showing an average latency time of 0.9 ± 0.2 s for calcium signal to increase over 3 SD of baseline and 1.1 ± 0.2 s to increase to 50% of the maximum. Data are presented as mean values +/− standard error of the mean (n = 9 replicates with 15 cells in each replicate). (P ≥ 0.05 (N.S.), ****P < 0.0001. N.S., not significant.)
