
Fig. 3 |. Through-scalp NIR-II neuromodulation of the mouse hippocampus and motor cortex.
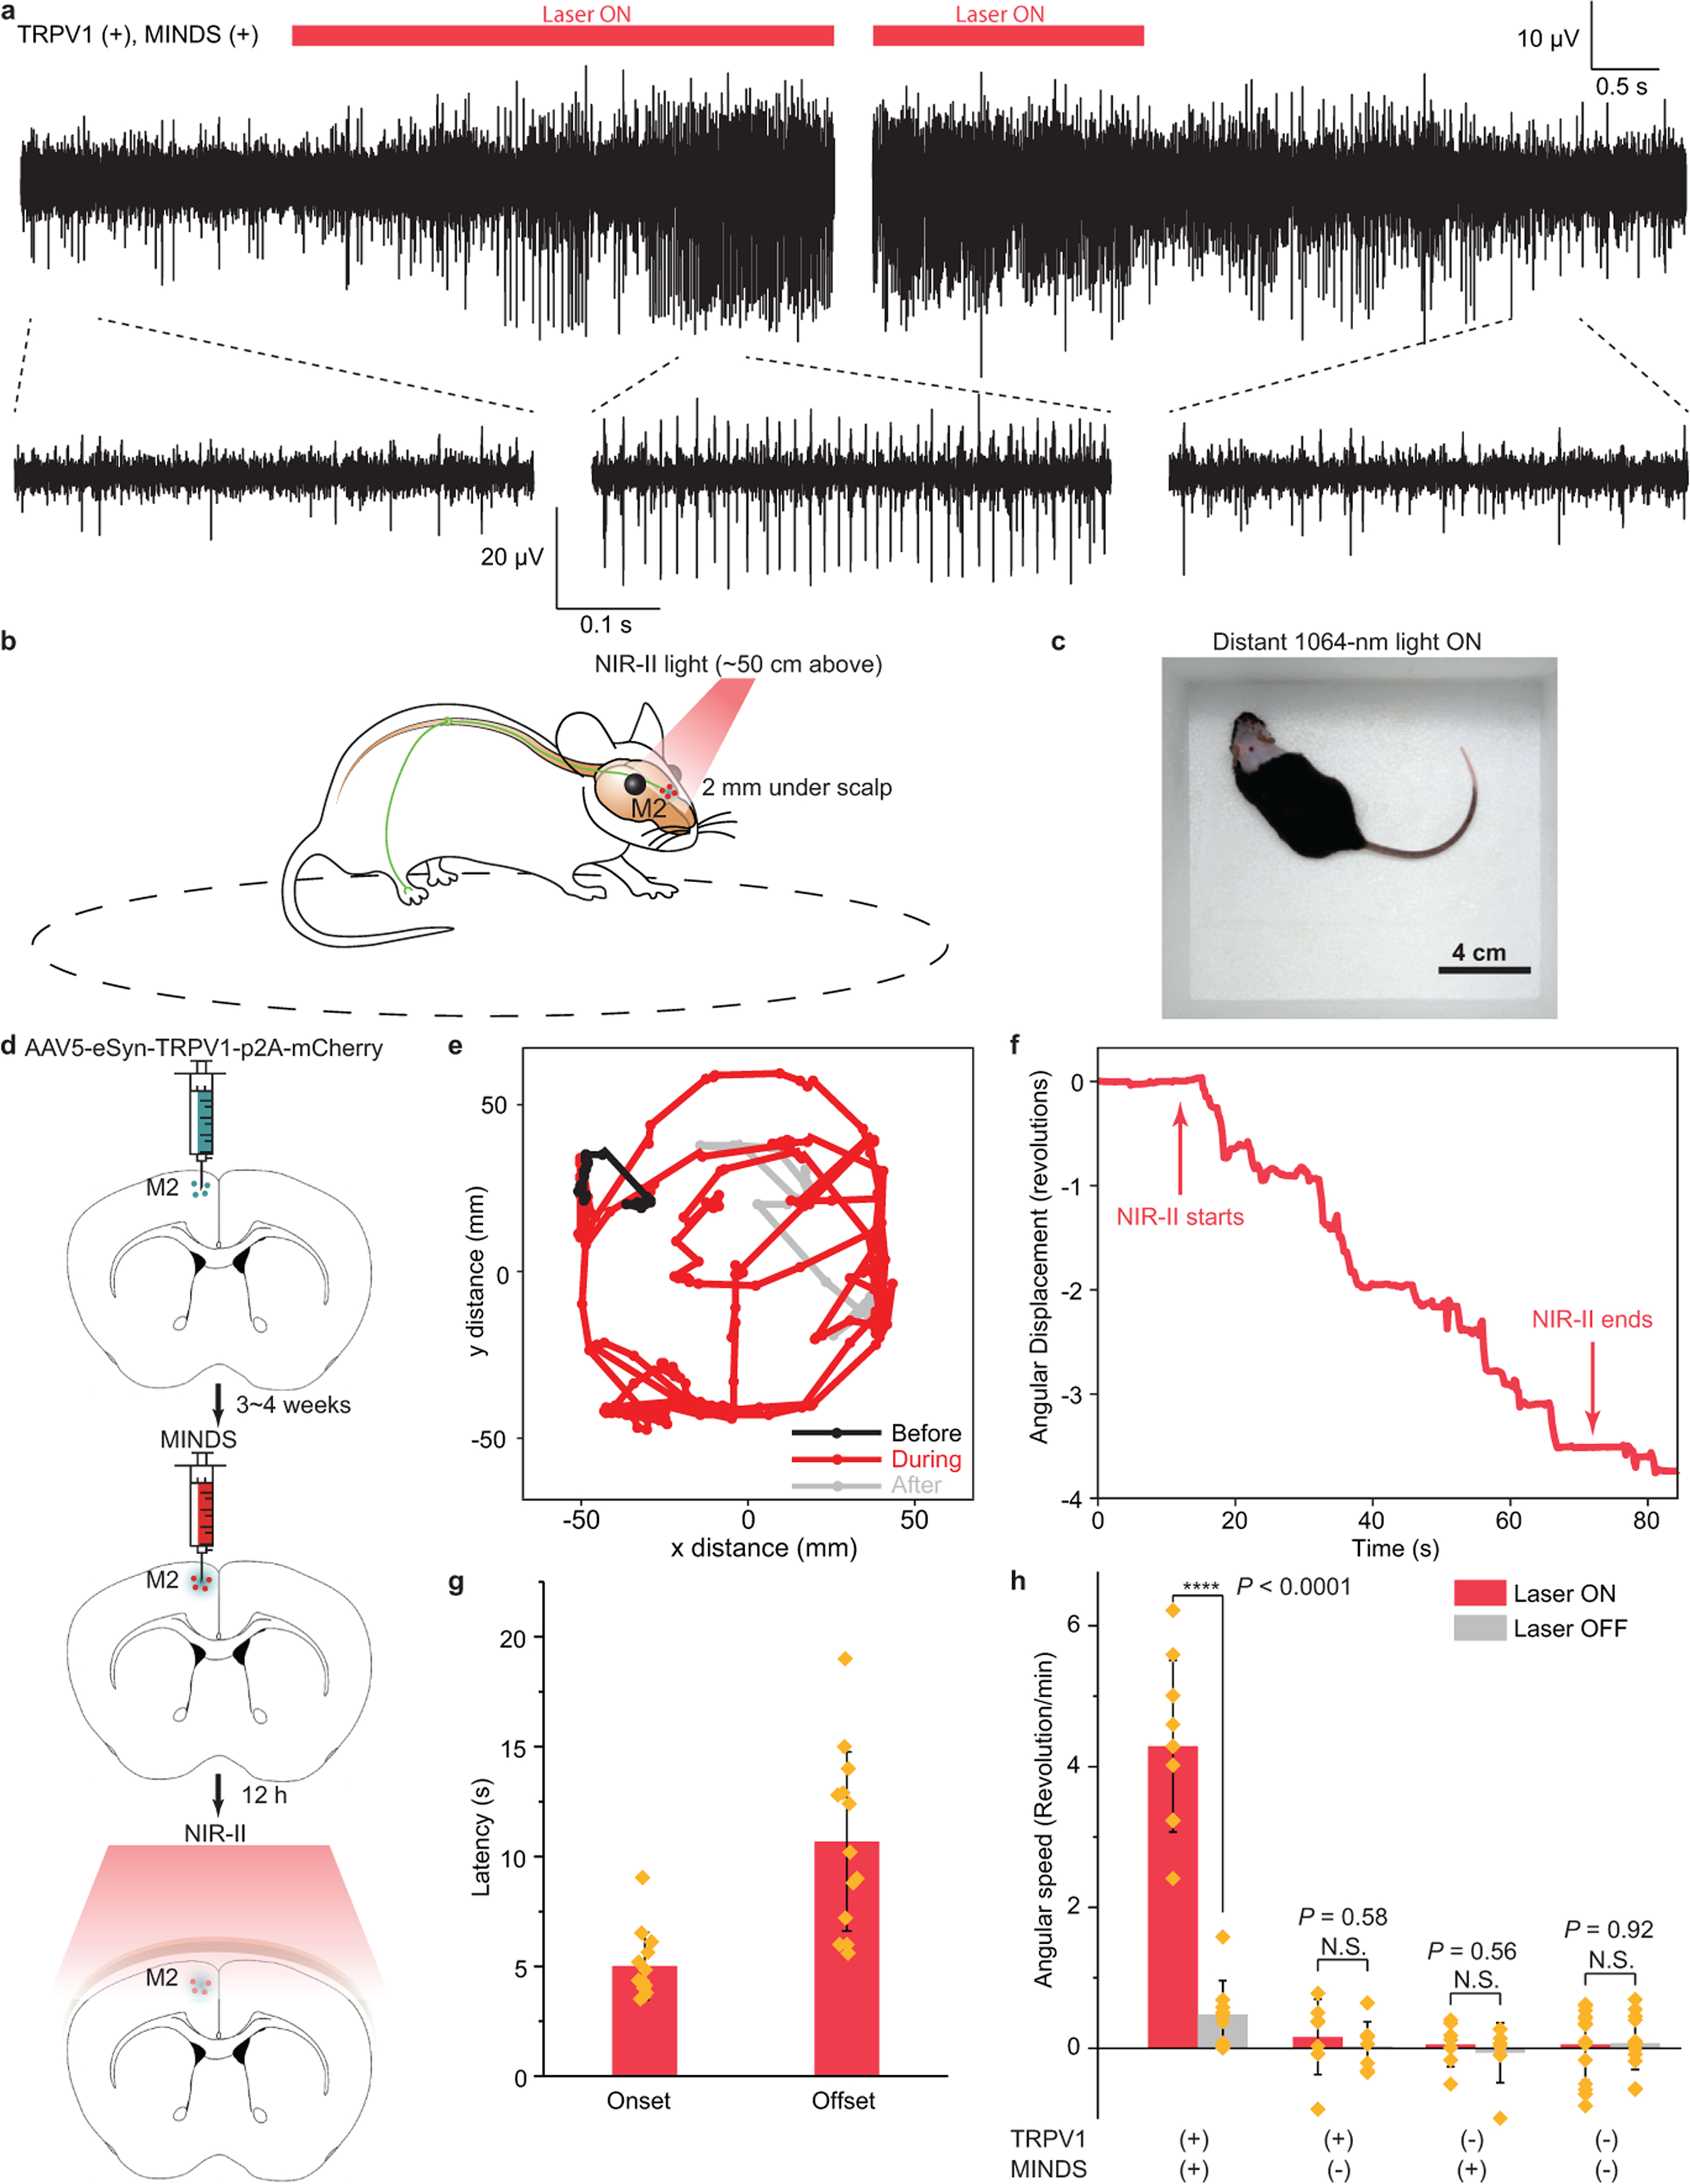
a, Representative traces showing the increase in neuron firing rate in the mouse hippocampus upon 1064-nm light illumination (left). The neuron firing rate returned to the baseline after the 1064-nm light was turned off (right). b, Schematic showing through-scalp NIR-II activation of motor neurons (located ca. 2 mm underneath scalp surface) that ectopically overexpress TRPV1 channels and project to the spinal cord for controlling the unilateral limb via the sensitization of MINDS (red dots). c, A representative image showing the arena for motor behavioural modulation by distant NIR-II illumination (invisible in the image since the camera used to take this image is insensitive to the NIR-II wavelength). d, Schematics illustrating the process of TRPV1 virus delivery (green dots, top), injection of MINDS (red dots, middle, where the green haze indicates neural tissue transduced with TRPV1), and NIR-II activation of TRPV1 neurons through the scalp (bottom). e, Trajectory of the mouse before (black), during (red) and after (gray) distant NIR-II illumination. f, Angular displacement (number of revolutions, where positive indicates counter-clockwise revolutions and negative indicates clockwise revolutions) before, during and after NIR-II illumination. g, Bar chart showing the statistics of onset and offset latency times for M2 neural stimulation with NIR-II illumination. See Methods for the definitions of onset and offset latency times. Data are presented as mean values +/− SD and each point indicates an independent trial from a total of N = 13 trials. h, Statistical analysis of rotational movements of animals under different experimental conditions. (n = 6 mice for TRPV1+/MINDS+ and n = 3 mice for all other groups; one-way ANOVA, F(1,16) = 76.13, P < 0.0001; F(1,12) = 0.32, P = 0.58; F(1,12) = 0.36, P = 0.56; F(1,26) = 0.01, P = 0.92). Data are presented as mean values +/− SD and each point indicates an independent trial. (P ≥ 0.05 (N.S.), ****P < 0.0001.)