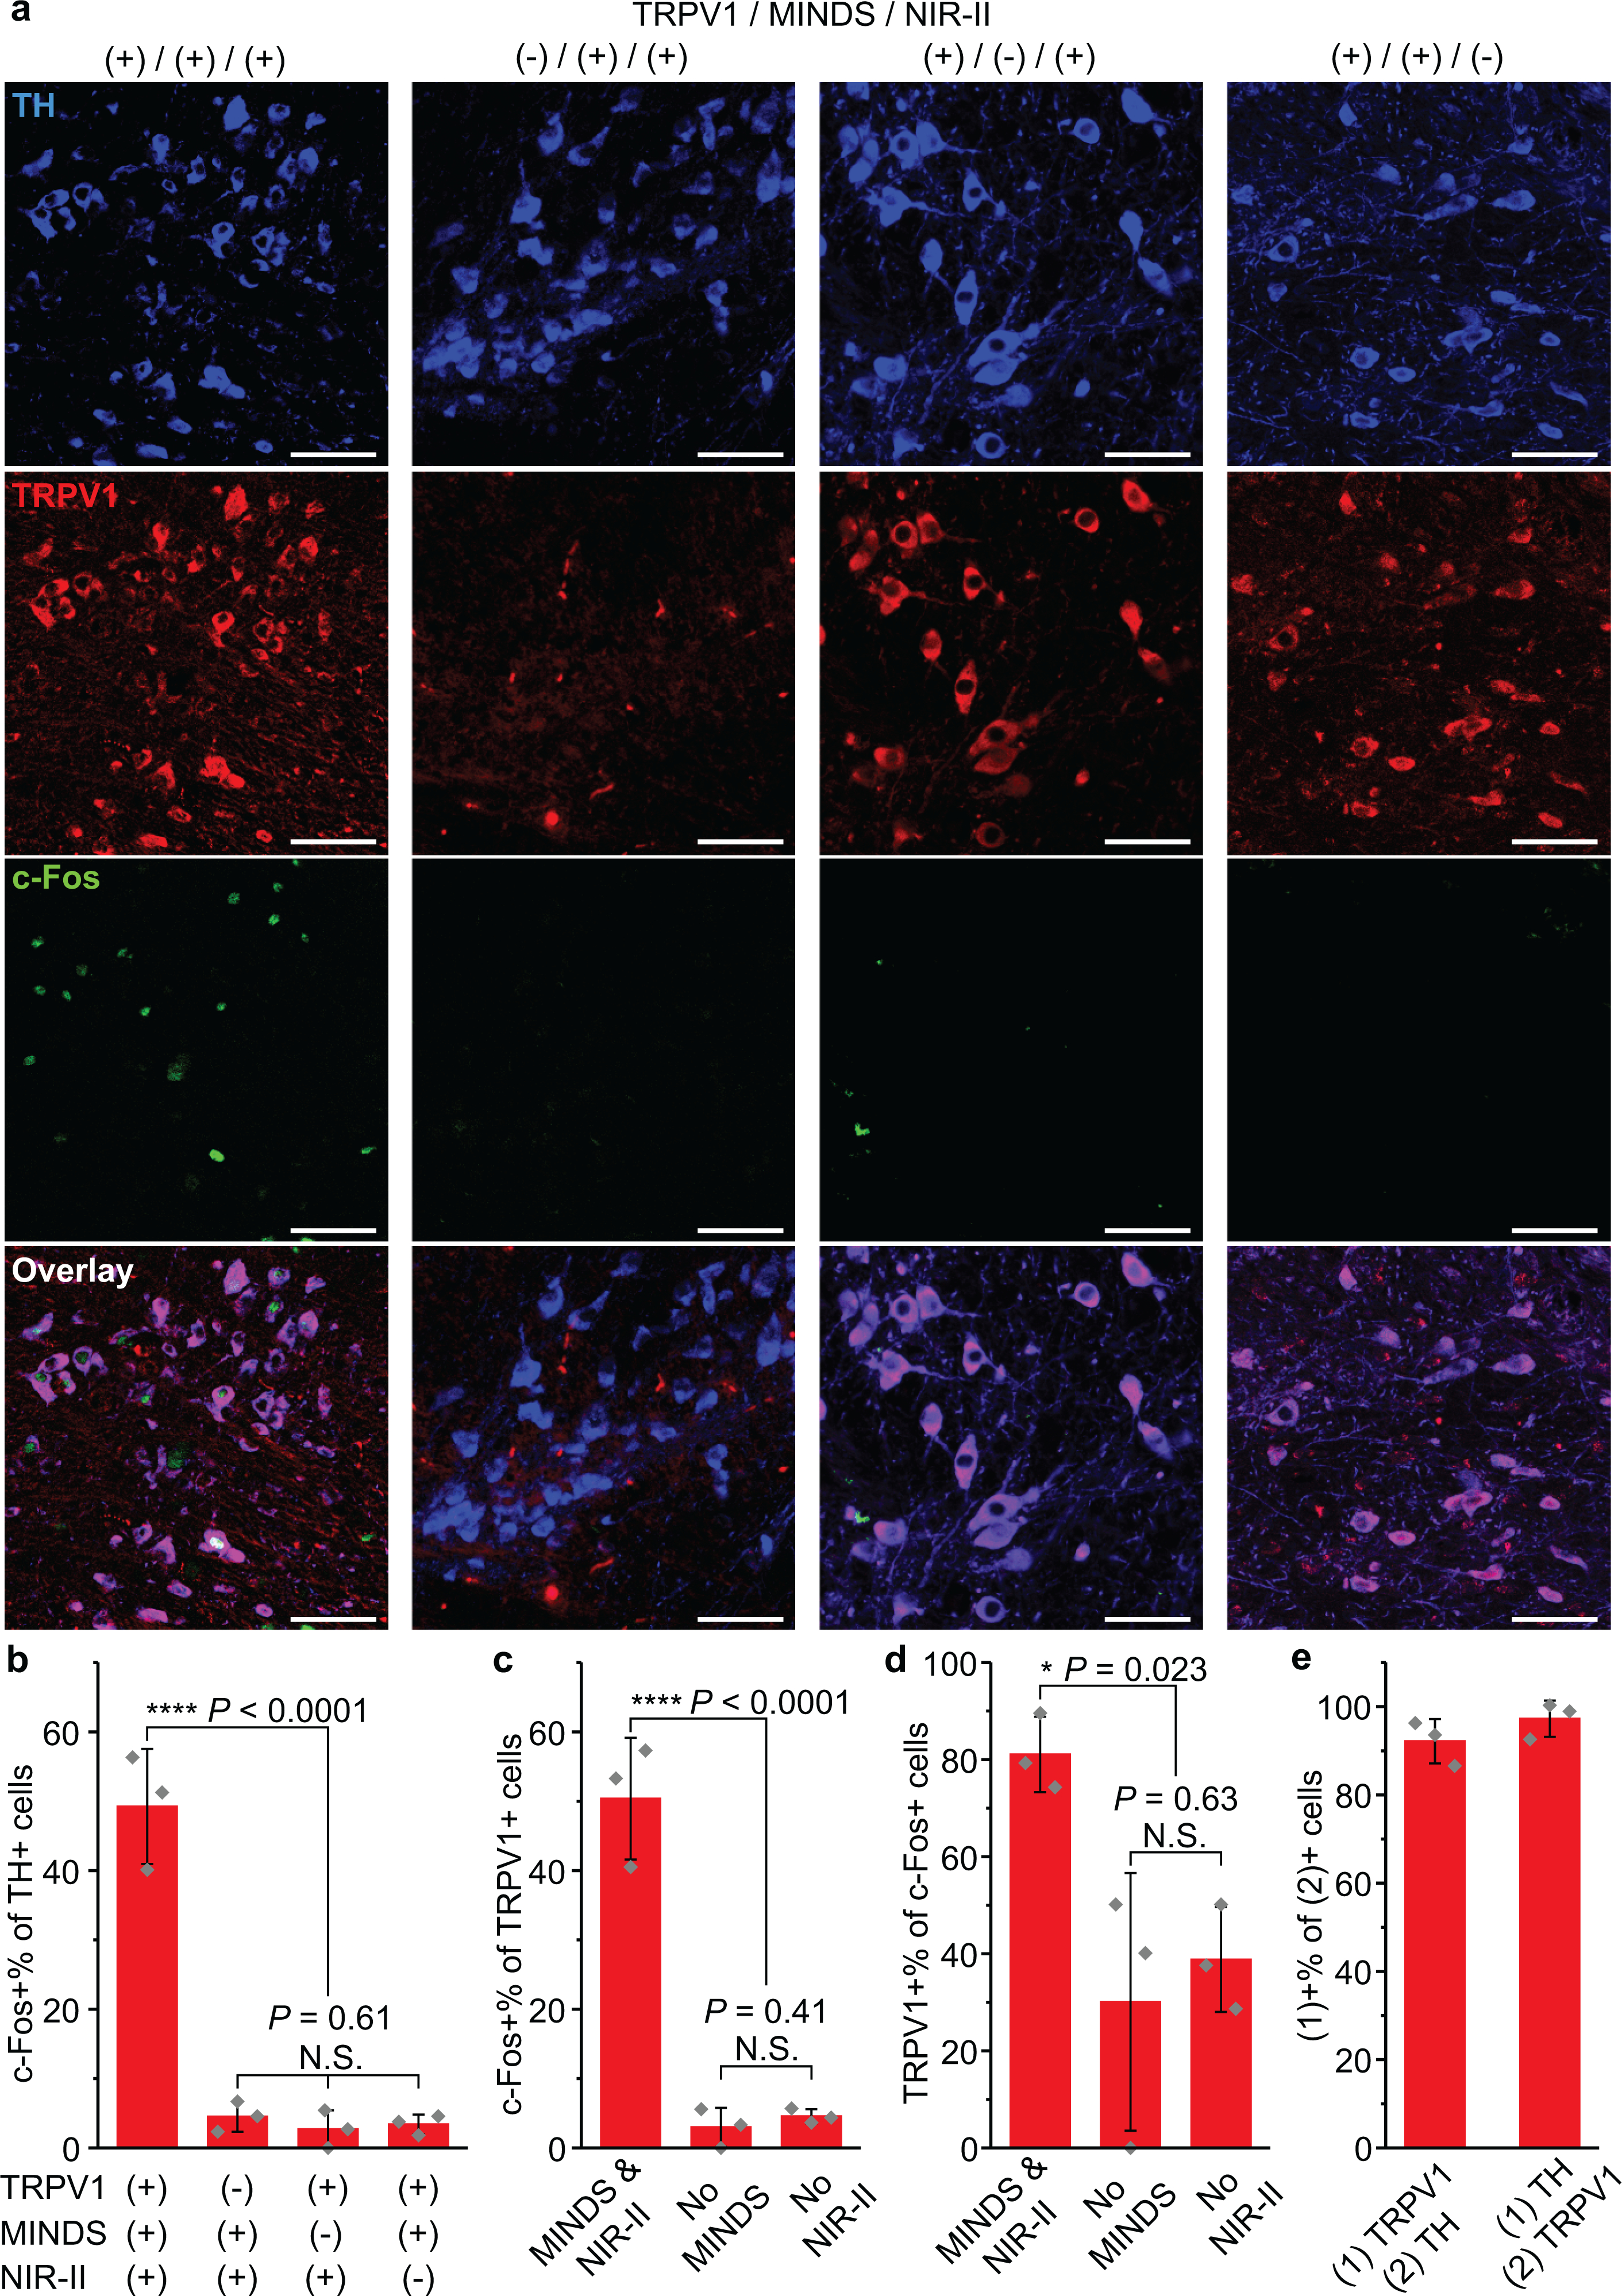
Fig. 6 |. Immunohistology of the VTA region after NIR-II illumination.

a, Confocal images of the VTA region under different experimental conditions. An increase in c-Fos expression driven by NIR-II stimulation was only observed in the presence of both TRPV1 and MINDS. The scale bars indicate 50 μm. The number of images taken is reflected in the n values for b–d. b, Percentage of c-Fos+ neurons in the TH+ cell population, corresponding to the four conditions presented in a. (One-way ANOVA, F(3,8) = 75.69, P < 0.0001; F(2,6) = 0.54, P = 0.61.) c, Percentage of c-Fos+ cells within the TRPV1+ cell population. (One-way ANOVA, F(2,6) = 75.83, P < 0.0001; F(1,4) = 0.85, P = 0.41.) d, Percentage of TRPV1+ cells within the c-Fos+ cell population. Both c and d were analysed for the three experimental groups with TRPV1 transduction. (One-way ANOVA, F(2,6) = 7.59, P = 0.023; F(1,4) = 0.28, P = 0.63.) e, Statistics of TRPV1 expression in TH+ neurons (left bar) and TH expression in TRPV1+ neurons (right bar). All data are presented as mean values +/− SD (n = 3 mice per group, P ≥ 0.05 (N.S.), *P < 0.05, ****P < 0.0001).
