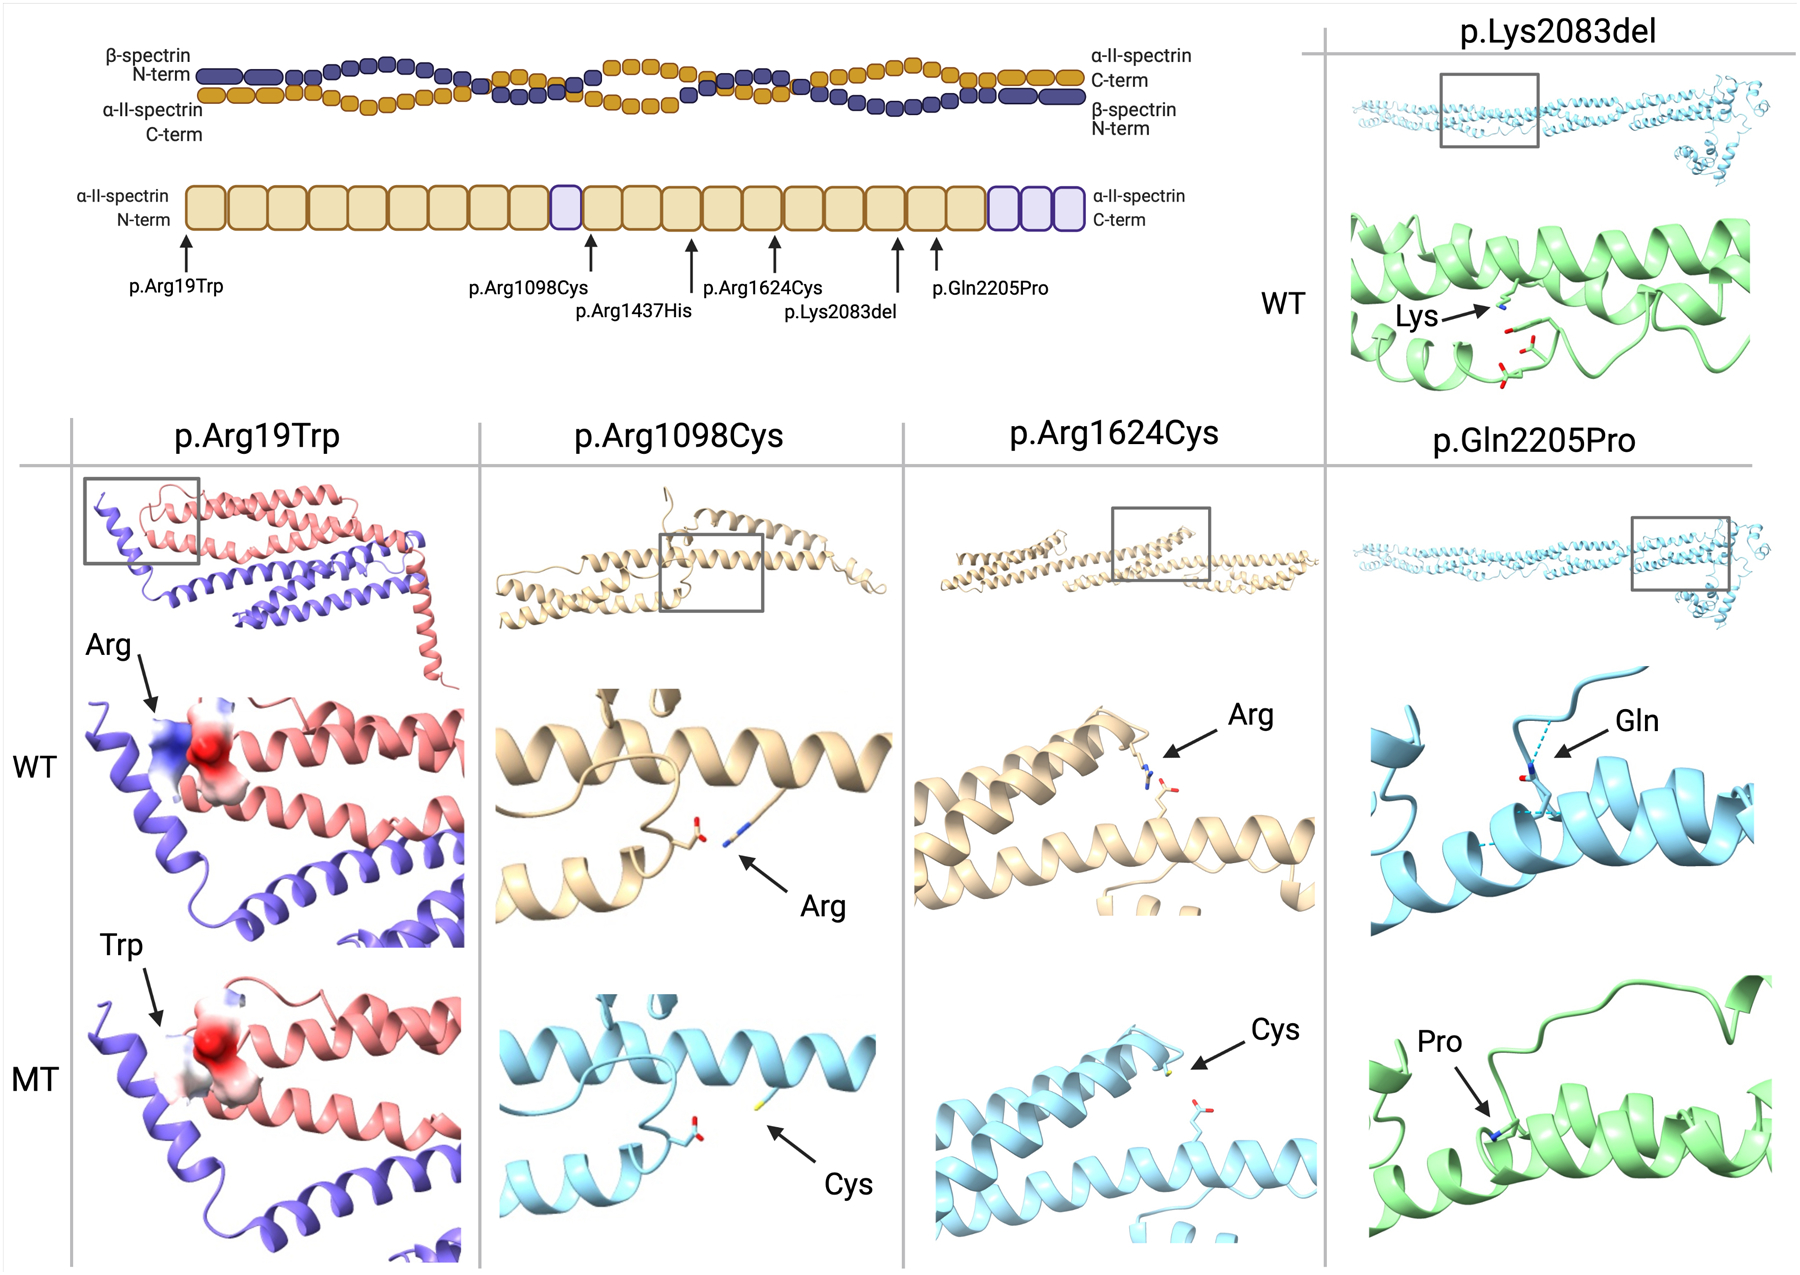
Figure 4: Protein modelling of respective SPTAN1 variants.

Top left panel: overview of the tetramer structure of the spectrin complex. Below, a graphical depiction of the α-II-spectrin protein structure with indication of the mutation locations. Top right panel: indication of the wild type Lys2083 residue, located across from three negatively charged residues. Bottom panel: comparison of the predicted wild type (WT) and mutant (MT) structures for every respective variant, with an overview of the location of the variant above. Positively charged residues are colored dark blue, negatively charged residues red. A hydrogen bond is indicated with a dotted line.
