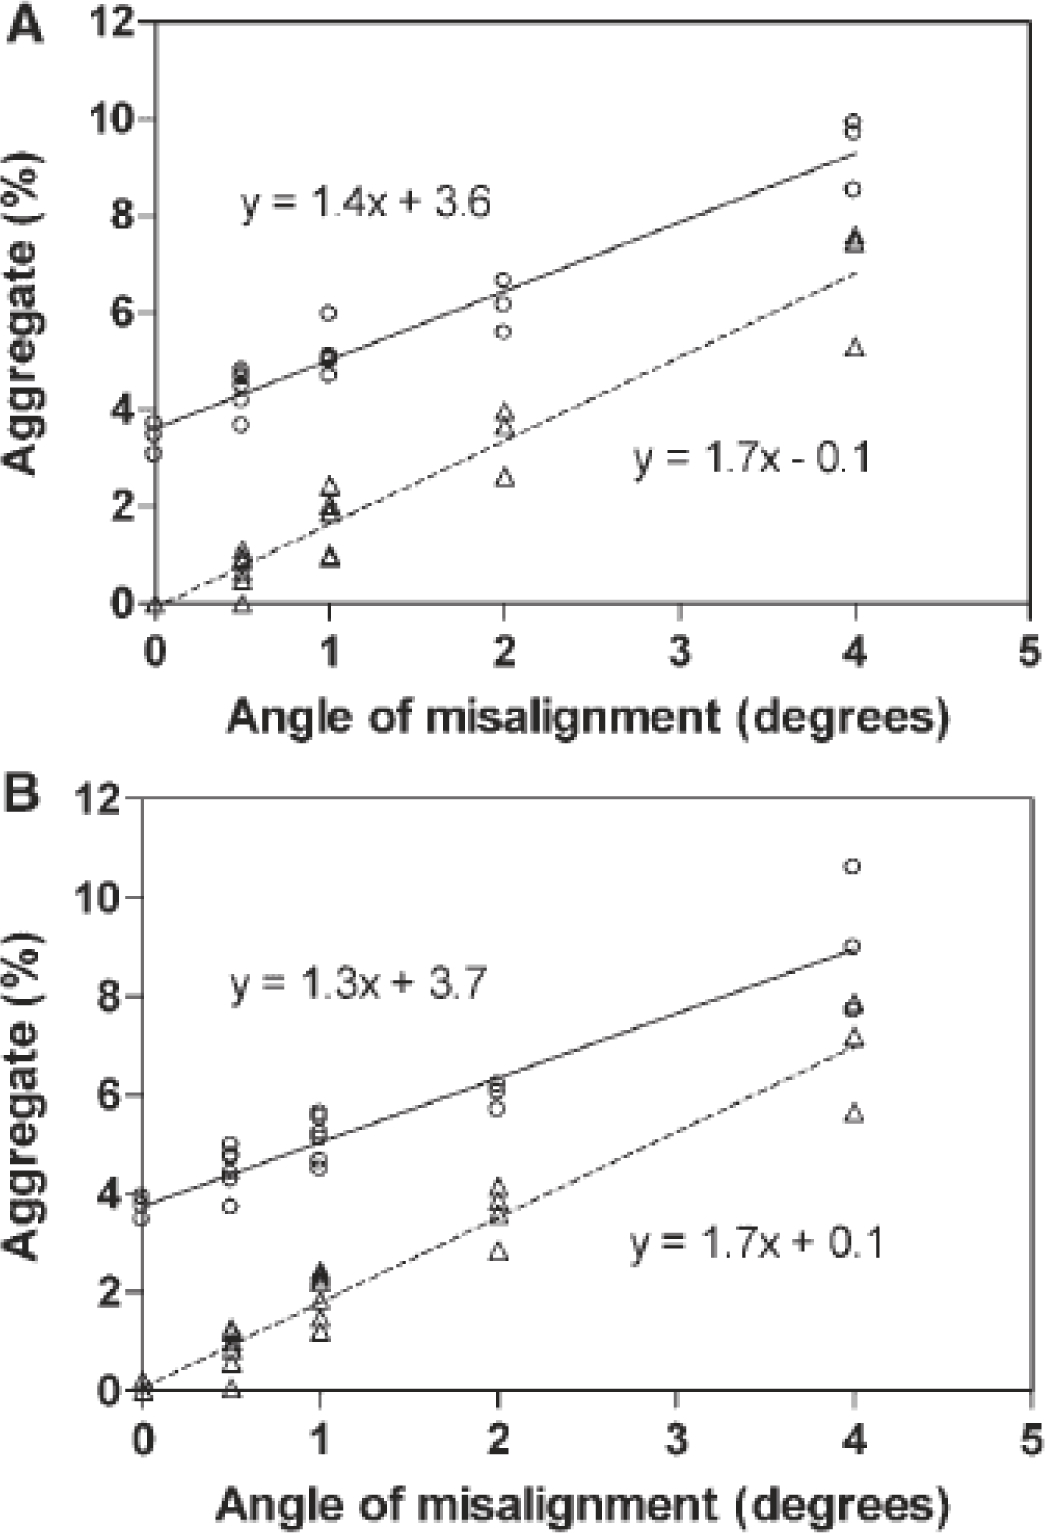
Figure 2.

(taken from [31]) Change in detected levels of dimer and HMWS as a function of cell misalignment from the center of rotation. Analyzed (A) without TI noise decomposition and (B) with TI noise decomposition. In both panels open circles denote dimer percentage (n=3 or 6) and open triangles denote HMWS percentage (n=3 or 6). A linear fit of the relationship between angle of misalignment and dimer (solid line) and HMWS (dashed line) percentage was used to estimate the effect of misalignment on aggregate level quantitation.
