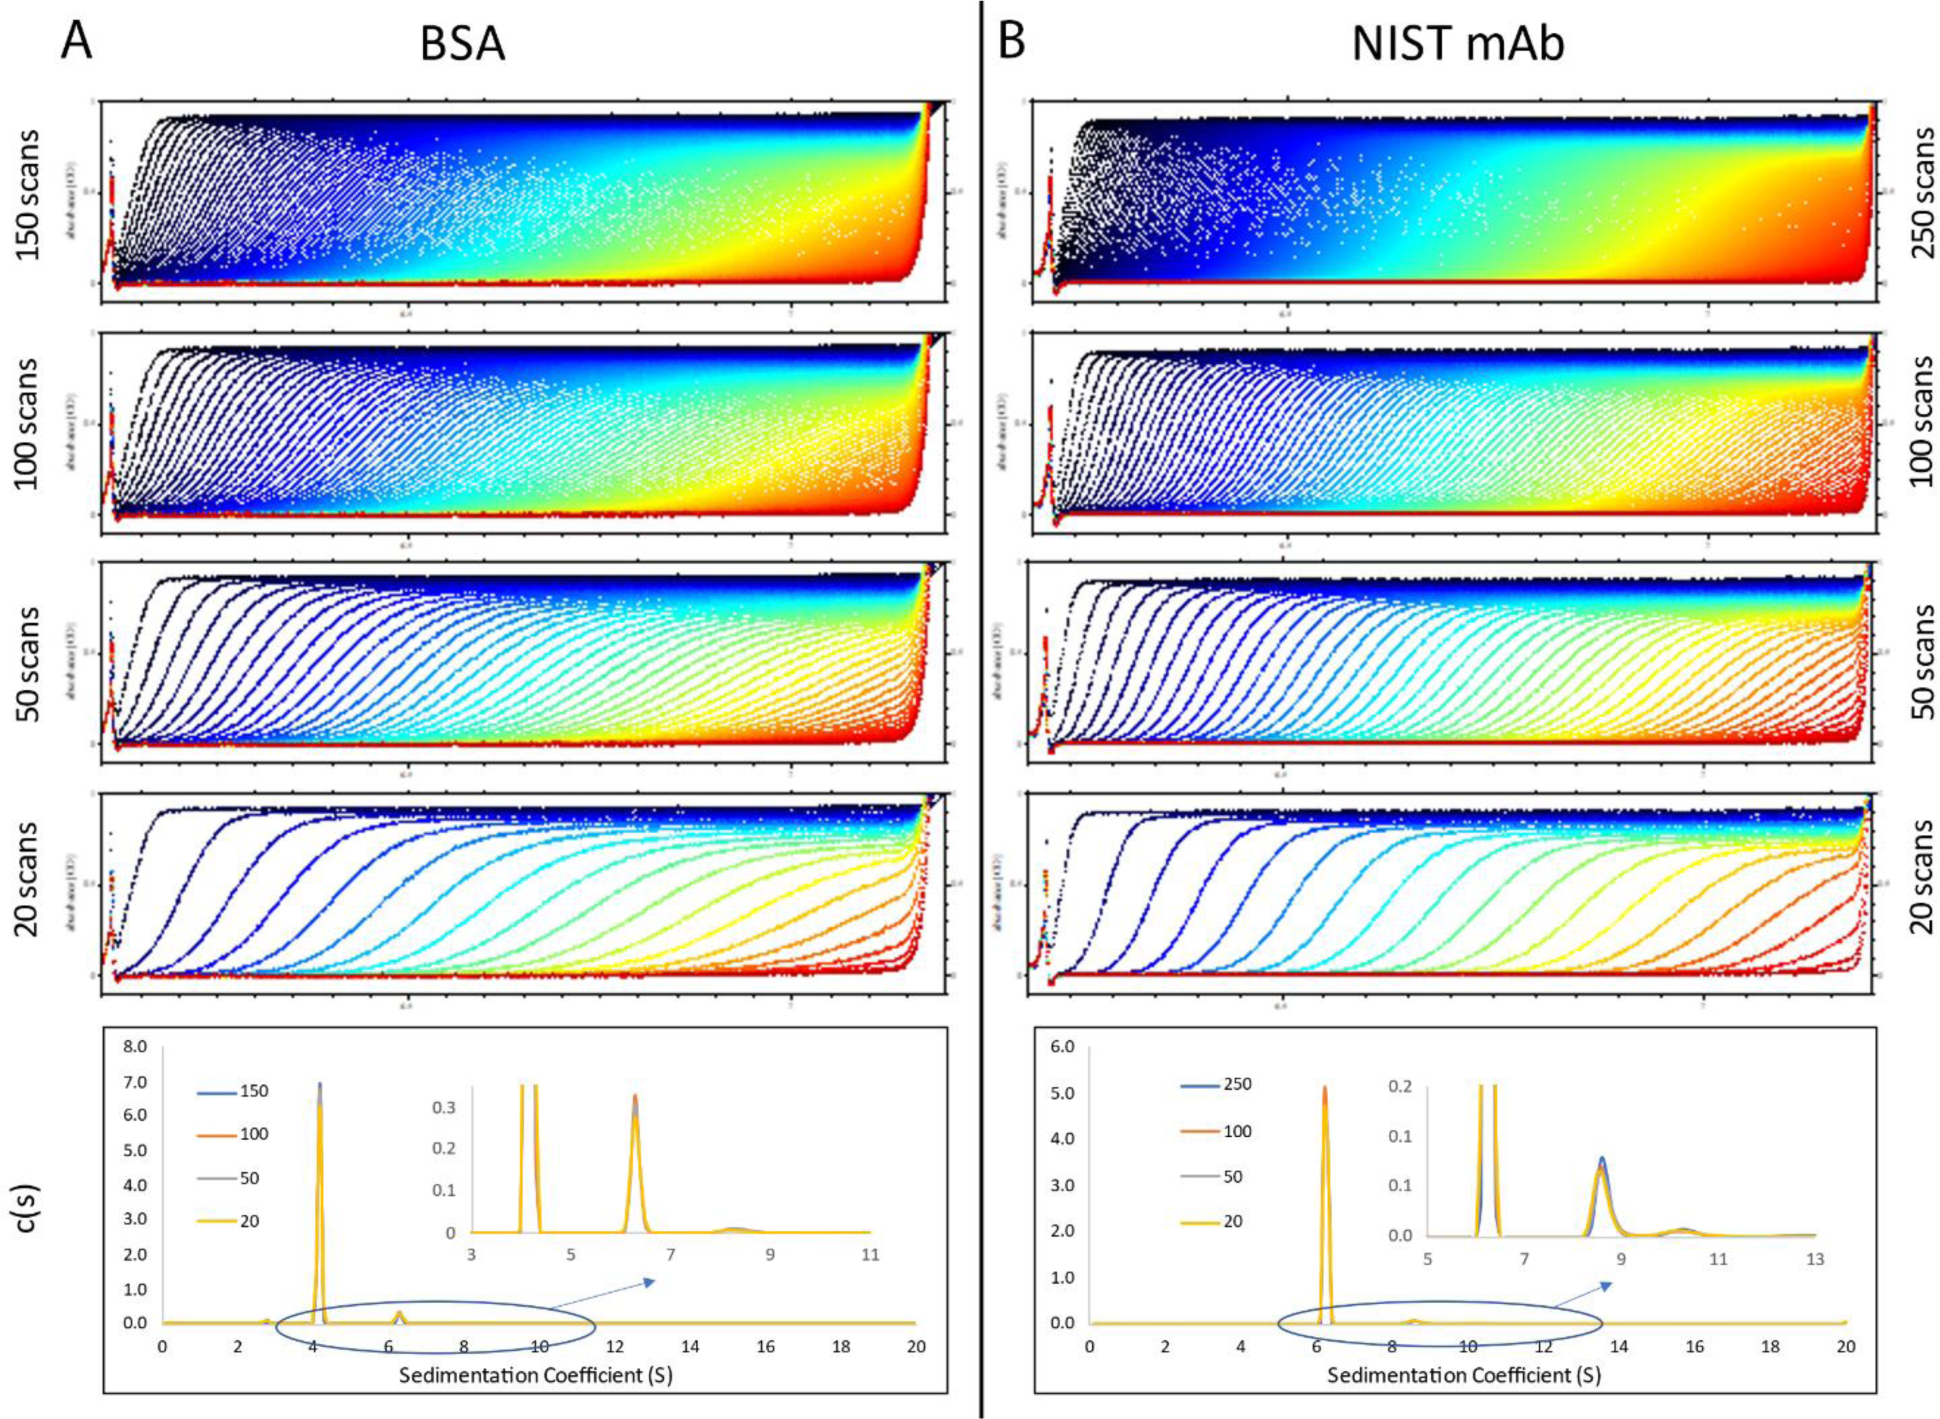
Figure 3.

Raw SV-AUC data (top four graphs) and overlay of c(s) distributions (bottom graph) for BSA (A) and the NIST mAb (B). For BSA, 300 scans were collected and covered the full sedimentation of all species present in the sample. The four raw data displays correspond to the loading of every 2nd, 3rd, 6th, and 15th scans (from top to bottom) in SEDFIT. For the NIST mAb, 500 scans were collected and covered the full sedimentation of all species present in the sample. The four raw data displays correspond to the loading of every 2nd, 5th, 10th, and 25th scans (from top to bottom) in SEDFIT. The NIST mAb data was collected with higher scanning frequency compared to the BSA data. The c(s) distributions corresponding to the independent fitting of each of the top four raw data files are highly similar.
