
Figure 4.
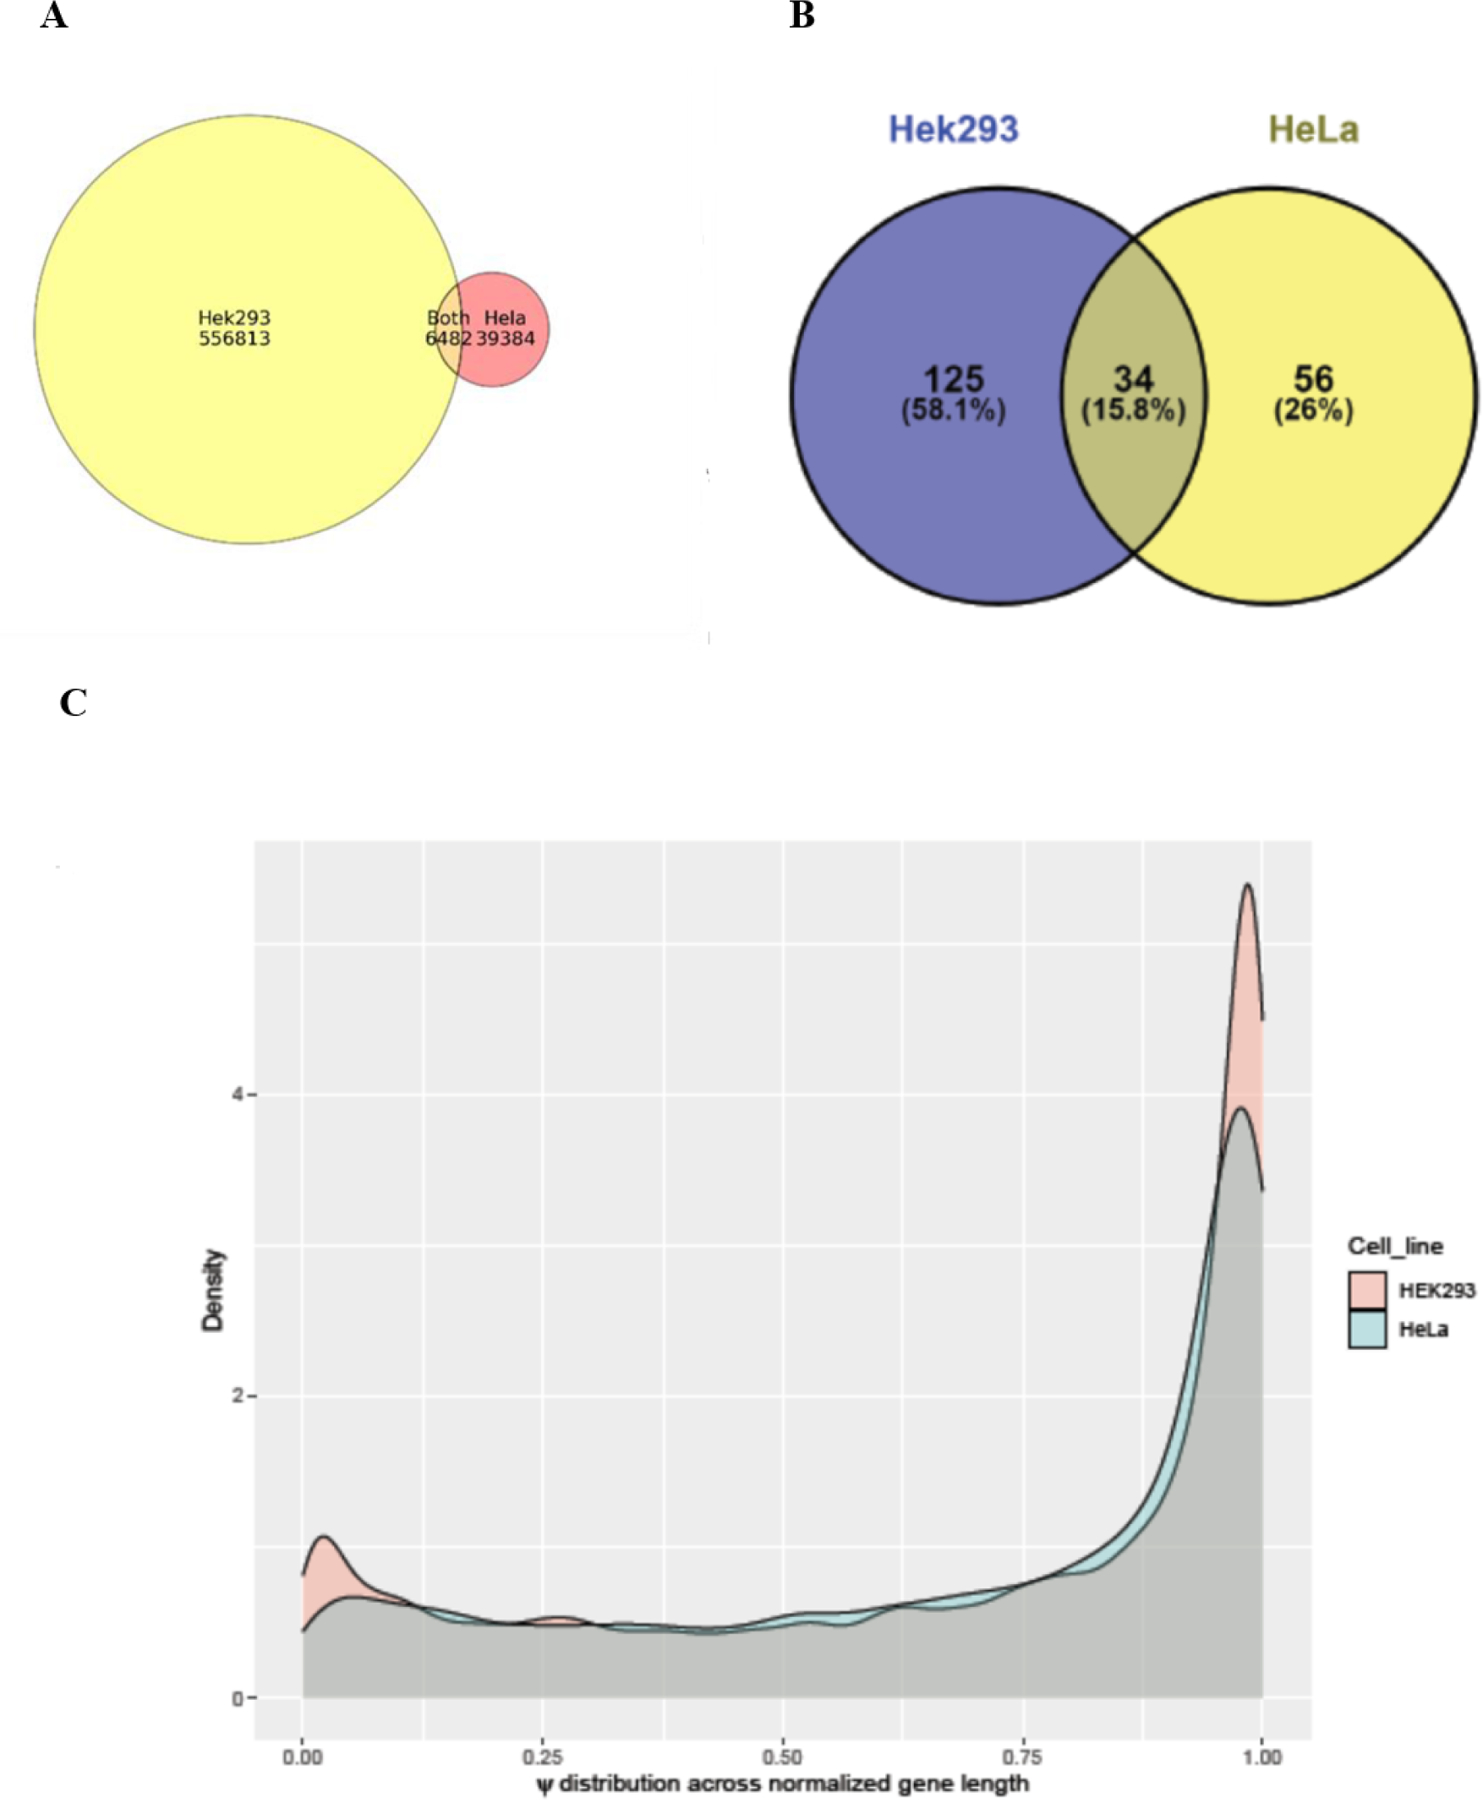
Plots showing (a) Venn diagram summarizing the overlap between unique Ψ locations predicted in complete Hek293 and Hela cell lines (b) Venn diagram showing the overlap between top frequent 1 % modified Ψ genes in Hek293 and Hela cell lines (c) Density plots representing ψ distribution across normalized gene lengths for Hek293 and Hela cell lines.