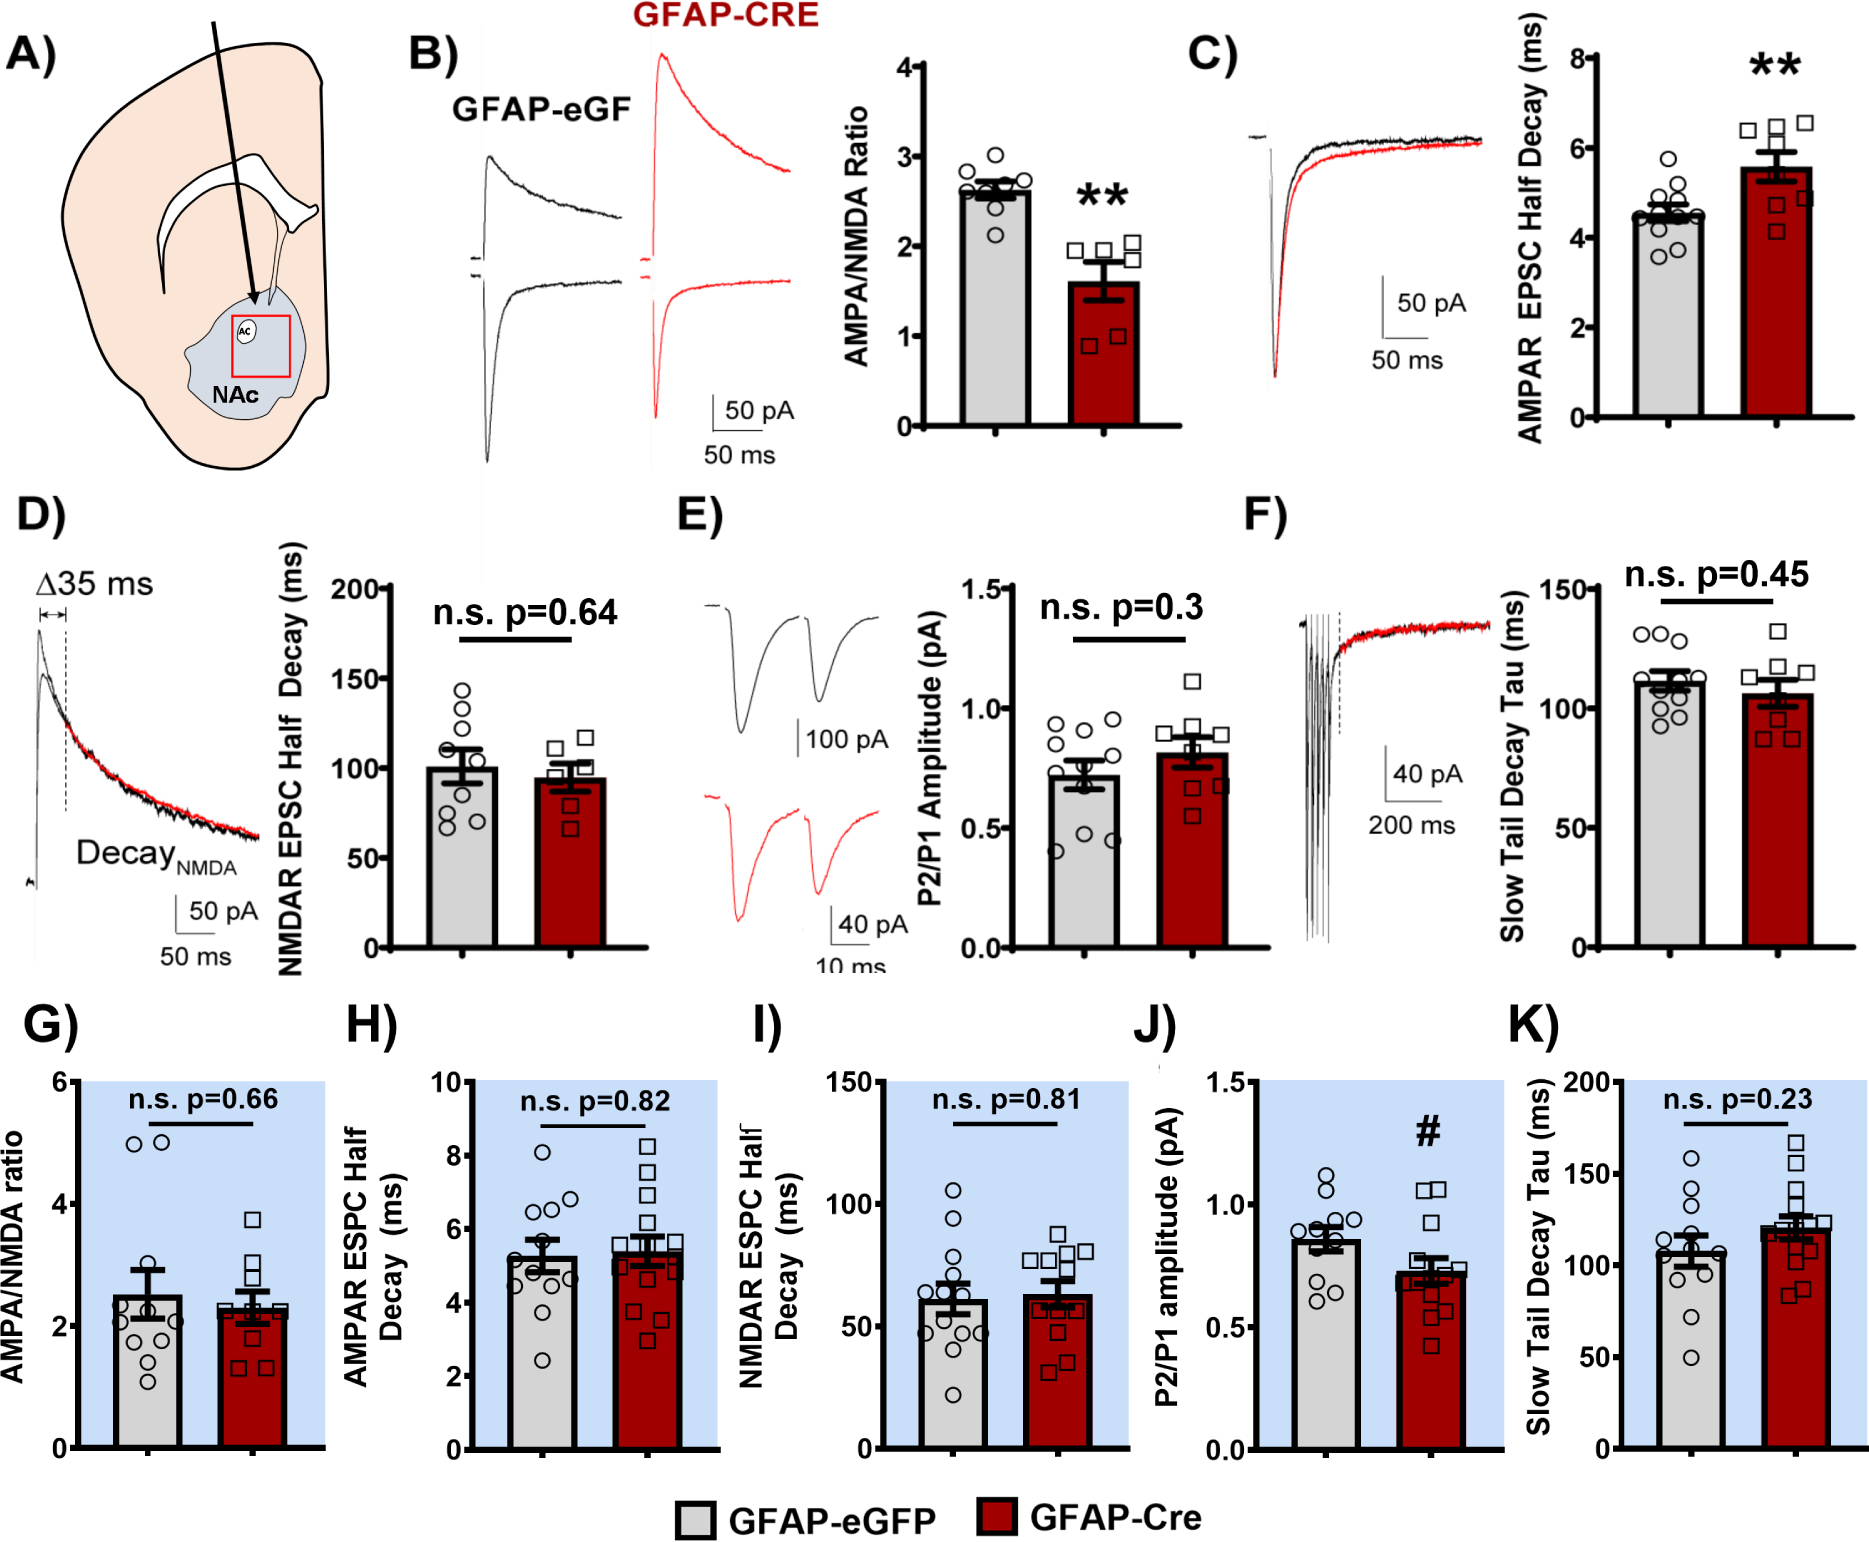
Figure 7. Loss of BMAL1 function in the NAc alters excitatory synaptic transmission onto neighboring MSNs during the day.

Slice electrophysiology was used to assess the effects of loss of BMAL1 function in NAc astrocytes on glutamatergic signaling in neighboring MSNs during the light and dark phases. (A) Location of stereotaxic injection of AAV8-GFAP-eGFP or AAV8-GFAP-Cre-GFP viral vectors and region targeted for slice electrophysiology experiments. (B) Representative traces (left) and quantification (right) of the AMPA/NMDA ratio. GFAP-Cre mice had a significantly lower AMPA/NMDA ratio compared to GFAP-eGFP controls (t(12) = 4.753, ** p<0.01, unpaired t-test). (C) Representative traces (left) and quantification showing that GFAP-Cre mice have slower AMPA decay kinetics, as measured by AMPA receptor half decay, compared to GFAP-eGFP controls (t(17) = 2.903, ** p<0.01, unpaired t-test). (D) However, there was no difference in NMDA receptor kinetics between GFAP-Cre mice and controls (representative traces, left; quantification, right; t(13) = 0.469, p=0.647, unpaired t-test). (E) Both GFAP-Cre and eGFP mice displayed a similar paired pulse ratio (P2/P1; i.e., EPSC2/EPSC1, measured at 20 ms ISI; t(17) = 1.063, p=0.303, unpaired t-test; representative traces, left; quantification, right). (F) Moreover, there was no difference in the tau of the slow tail decay after a train of high frequency extracellular stimulation (5 × 0.5 ms 50μA pulses at 50Hz) between GFAP-Cre and eGFP mice (measured from 35 ms following the peak of the last AMPA receptor EPSC; t(17) = 0.769, p=0.453, unpaired t-test; representative traces, left; quantification, right). Notably, when recording at night, no significant differences were seen in (G) AMPA/NMDA ratio (t(18) = 0.4396, p=0.665, unpaired t-test), (H) AMPA decay kinetics (t(24) = 0.2177, p=0.829, unpaired t-test), (I) NMDA decay kinetics (t(23) = 0.2336, p=0.817, unpaired t-test), (J) paired pulse ratio (t(22) = 1.781, # p=0.088, unpaired t-test), though trending, nor (K) tau of the slow tail decay (t(24) = 1.225, p=0.2323, unpaired t-test) between GFAP-Cre and eGFP controls. Red traces indicate GFAP-Cre group. Recordings performed ZT4–6 and ZT16–18. Blue background indicates behavior run during the night (ZT 14–18). Mean± SEM. n=6–14. ** p<0.01. n.s. = not significant.
