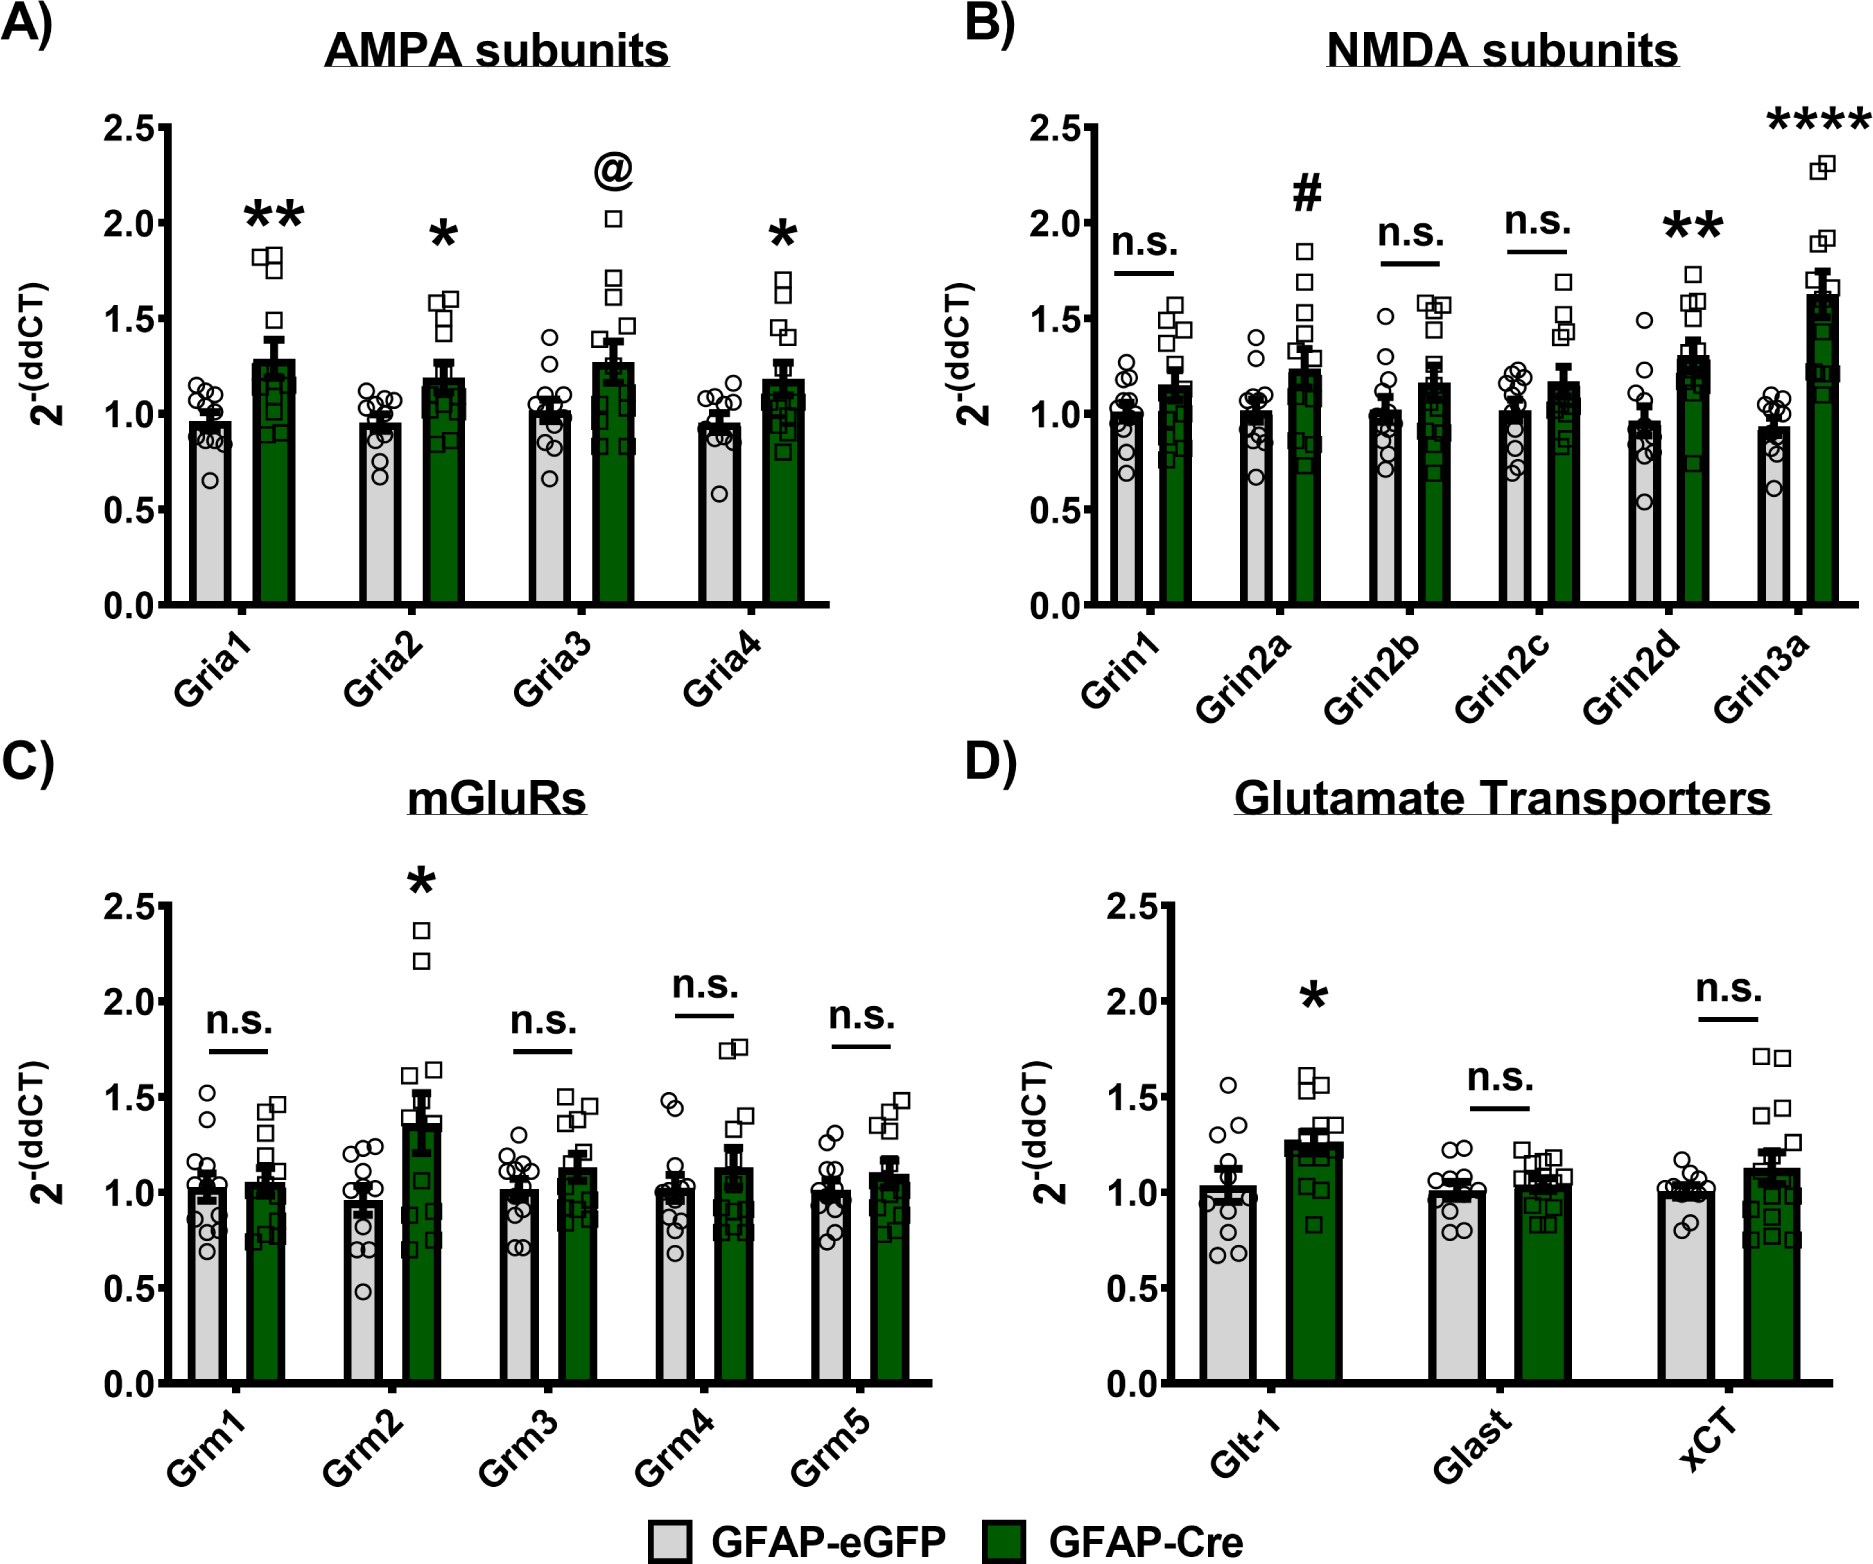
Figure 8. Loss of BMAL1 function in NAc astrocytes upregulates NAc glutamate-related gene expression during the day.

NAc tissue from BMFL mice expressing NAc-specific GFAP-Cre or eGFP control was processed through RT-qPCR assessing daytime whole NAc gene expression of AMPA receptor subunits, NMDA receptor subunits, mGluR receptors, and astrocyte-specific glutamate transporters (ZT4–6). (A) GFAP-Cre mice show significantly upregulated expression of nearly all AMPA receptor subunits, including Gria1 (t(21) = 2.874, ** p<0.01, unpaired t-test), Gria2 (t(21) = 2.583, * p=0.017), Gria4 (t(21) = 2.267, * p<0.05), and a trending increase in Gria3 (t(22) = 2.072, @ p=0.05), all relative to eGFP controls. (B) Looking at NMDA receptor subunit gene expression, only Grin2d (t(21) = 3.156, ** p=0.0048) and Grin3a (t(21) = 5.246, **** p<0.0001) show significant upregulation, with Grin2a (t(22) = 1.92, # p=0.06) showing a trending increase, relative to controls. No significant differences between GFAP-Cre and eGFP control were detected for Grin1 (t(22) = 1.491, p=0.15), Grin2b (t(22) = 1.276, p=0.21), and Grin2c (t(22) = 1.555, p=0.13), while Grin3b was not detectable at all in our whole NAc tissue samples (data not shown). (C) In addition to AMPA and NMDA receptor subunits, we also investigated the expression of the G-protein-coupled mGluR glutamate receptors. GFAP-Cre significantly increased Grm2 relative to eGFP controls (t(21) = 2.257, * p<0.05), but no significant differences were detected in Grm1 (t(22) = 0.2711, p=0.78), Grm3 (t(22) = 1.295, p=0.2), Grm4 (t(22) = 0.8764, p=0.39), or Grm5 (t(22) = 0.9804, p=0.33) expression in the NAc. (D) Finally, expression of astrocyte-specific glutamate transporters was also assessed in the whole NAc of GFAP-Cre and eGFP control mice. Glt-1 (i.e., SLC1A2 or EAAT2) was significantly upregulated in GFAP-Cre mice relative to controls (t(23) = 2.225, * p<0.05), while no significant differences were seen with Glast (i.e., SLC1A3 or EAAT1; t(23) = 0.5574, p=0.58) or the xCT cystine-glutamate antiporter (i.e., SLC7A11; t(24) = 0.2397, p=0.23) expression. Gene expression normalized to 18s. Mean± SEM. n=11–15. # p=0.06; @ p=0.05, * p<0.05, ** p<0.01, **** p<0.0001. n.s. = not significant.
