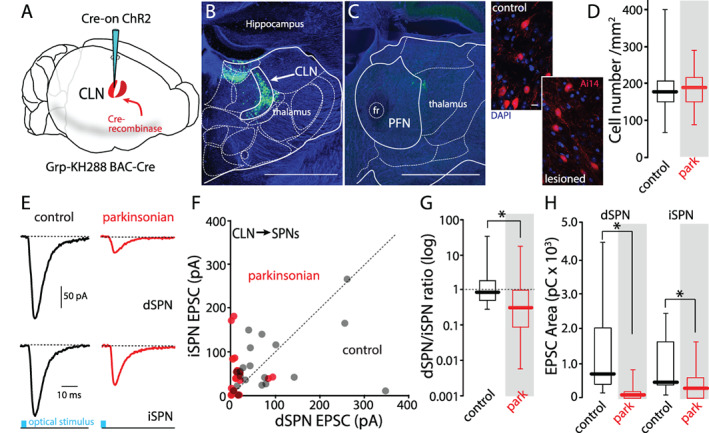
FIG 1.

CLN‐evoked responses were smaller in both iSPNs and dSPNs from parkinsonian mice. (A) Schematic diagram of injection scheme. Cre‐on ChR2 was injected into the CLN of the Grp‐KH288 Cre mouse. (B) Confocal image of the coronal slice containing CLN from a D1‐tdTomato/Grp‐KH288 Cre mouse injected with Cre‐on ChR2. ChR2‐eYFP was expressed by CLN neurons. (C) A confocal image of the coronal slice containing PFN from the same brain is shown in (B). Scale bars: 1 mm. (D) Left: confocal images showing tdTomato‐positive CLN neurons in control and 6‐OHDA lesioned mice. Right: box plots of the density of tdTomato‐positive neurons in CLN. Control (N = 4), 6‐OHDA (N = 5). Control median value: 117, parkinsonian median value: 189. Differences between groups were not significant (P = 0.531, rank‐sum test). Scale bar: 10 μm. (E–H) Dual whole‐cell patch patch‐clamp recording from a dSPN and an iSPN. CLN axons were activated by large area optical stimulation. (E) Representative traces showing CLN‐EPSCs evoked by laser stimulation (8.35 mW, 5 ms). (F) Scatter plots of peak amplitudes of paired dSPN and iSPN CLN‐ EPSCs from control (black) and parkinsonian (red) mice. Filled black circles are control mice (n = 17 pairs, N = 10) and filled red circles are parkinsonian mice (n = 21 pairs, N = 8). (G) Box plots of log [dSPN/iSPN] ratios from scatter plot in (F). Median dSPN/iSPN ratios; control: 0.88, parkinsonian: 0.33. Control vs. parkinsonian; P = 0.022, rank‐sum test. (H) Box plots of EPSC areas from scatter plots in (F). Median charge in dSPN (pC); control: 714.41, parkinsonian: 97.92, control vs. parkinsonian; P < 0.001, rank‐sum test. Median charge in iSPN (pC); control: 467.46, parkinsonian: 297.54. Control vs. parkinsonian; P = 0.034, rank‐sum test. [Color figure can be viewed at wileyonlinelibrary.com]
