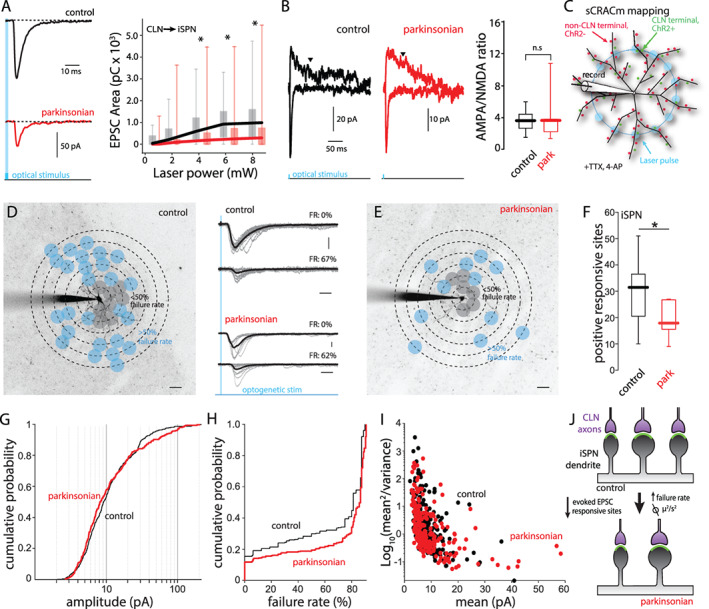
FIG 2.

The reduction of CLN‐evoked responses on iSPN was attributable to synaptic pruning. (A) Input–output curves of CLN‐evoked EPSCs in iSPNs from control (black) and parkinsonian (red) mice. Left: Representative traces of CLN‐evoked EPSCs. Right: CLN‐EPSC areas (pC) are plotted against laser intensity. Control vs. parkinsonian (laser power [mW]): P = 0.033 (8.35), P = 0.023 (6.25), P = 0.026 (4.41), P = 0.089 (2.04), P = 0.077 (0.98), rank‐ sum test. Control: n = 20, N = 9. Parkinsonian: n = 26, N = 10. (B) AMPA/NMDA ratios of CLN synapses on iSPNs from control and parkinsonian mice. Left: representative traces showing CLN‐EPSCs evoked by large area stimulation. AMPA EPSCs were measured by peak amplitude at −70 mV. NMDA EPSCs were measured at +40 mV. Downward arrowheads indicate the time point (200 ms from stimulation) when NMDA EPSCs were measured. Right: box plots of AMPA/NMDA ratios of CLN synapses on iSPN from control and parkinsonian mice. Control vs. parkinsonian; P = 0.6943, rank‐sum test. Control: n = 8, N = 4. Parkinsonian: n = 7, N = 4. (C) Schematic diagram of sCRACm CLN mapping. The diagram shows the example of blue laser stimulation on a middle concentric circle. (D and E) Example CLN input mappings from iSPNs of control (D) and parkinsonian (E). Projection image superimposed by mapping grid. Gray dots indicate responsive sites with <50% failure rates. Blue dots indicate responsive sites with 51% < failure rate < 90%. Scale bar; 20 μm. Middle: example traces with failure rate (FR). Gray thin lines are evoked responses at a typical stimulation spot. Thick black lines are averages of the individual traces. Scale bar: 20 pA and 20 ms. (F) Box plots of responsive sites in iSPN from control and parkinsonian mice. Control median value; 31.5, parkinsonian median value; 19.5. Control vs. parkinsonian; P = 0.0258, rank‐sum test. Control: n = 14, N = 12, parkinsonian: n = 14, N = 8. (G) Cumulative probability of CLN‐iSPN EPSC peak amplitudes obtained from input mapping experiments. Control vs. parkinsonian; P = 0.2634, KS test. Control: event number: n = 469, parkinsonian: event number: n = 298. (H) Cumulative probability of failure rates of CLN‐iSPN EPSC. P < 0.001, KS test. Control: event number: n = 913, parkinsonian: event number: n = 1162. (I) Variance plots of CLN‐iSPN EPSC. The events with over 50% failure rates were analyzed. Control: event number: n = 234, parkinsonian: event number: n = 232. (J) Summary diagram of the change of CLN synapses on iSPN. [Color figure can be viewed at wileyonlinelibrary.com]
