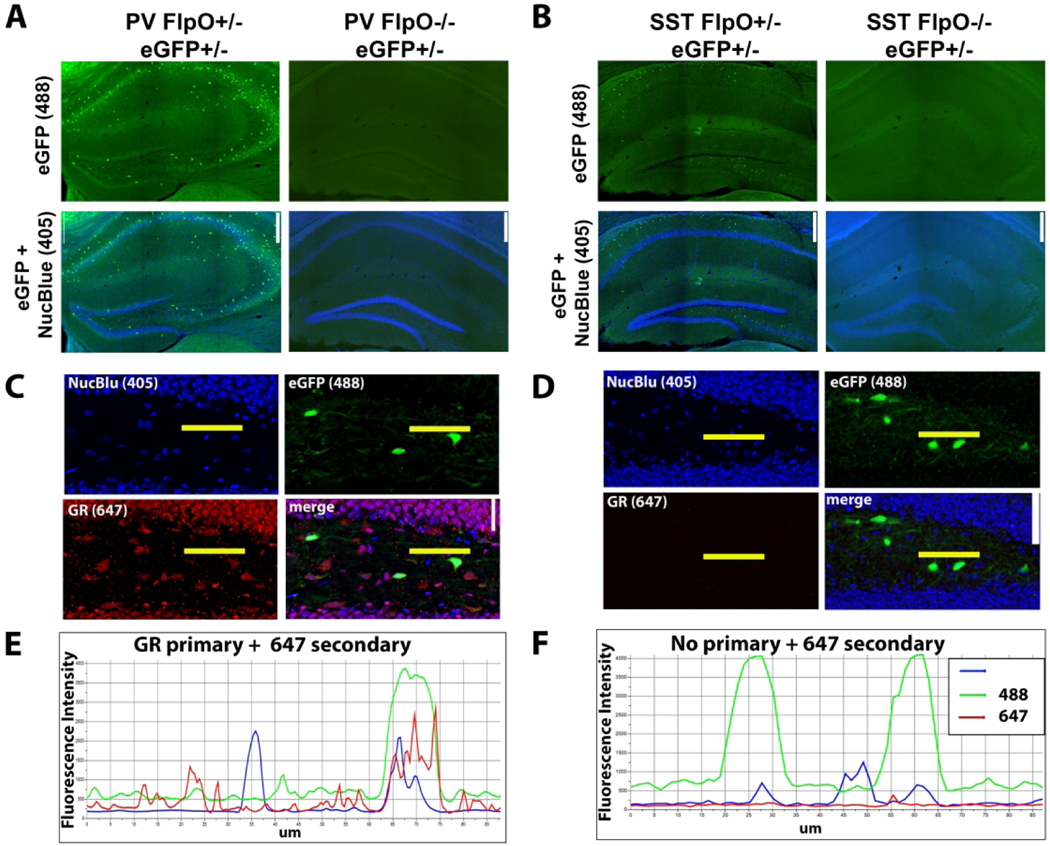
Figure 1. Transgenic labeling of interneurons.
A & B: Flippase-mediated recombination led to robust eGFP (488) labeling of PV (A) and SST (B) interneurons in the hippocampus, while flippase-negative control mice lacked eGFP expression. Scale bar = 250 μm. C & D: Confocal images of dentate gyri in SST-eGFP tissue immunostained with GR antibodies (C) and a no-primary control, for which the GR antibody was excluded (D). Scale bar = 25 μm. E & F: Fluorescence intensity profiles for 405 (nuclear blue), 488 (eGFP) and 647 (GR) channels along the length (Mm from left to right) of the horizontal yellow lines shown in C and D. GR immunostained tissue shows corresponding peaks for nuclear blue, eGFP and GR immunoreactivity (E), while the GR peak (red line) is absent from the no-primary control (F). Fluorescence intensity from no-primary controls was also used to determine background fluorescence and establish a threshold (2x background) for defining GR-positive from GR-negative cells.

