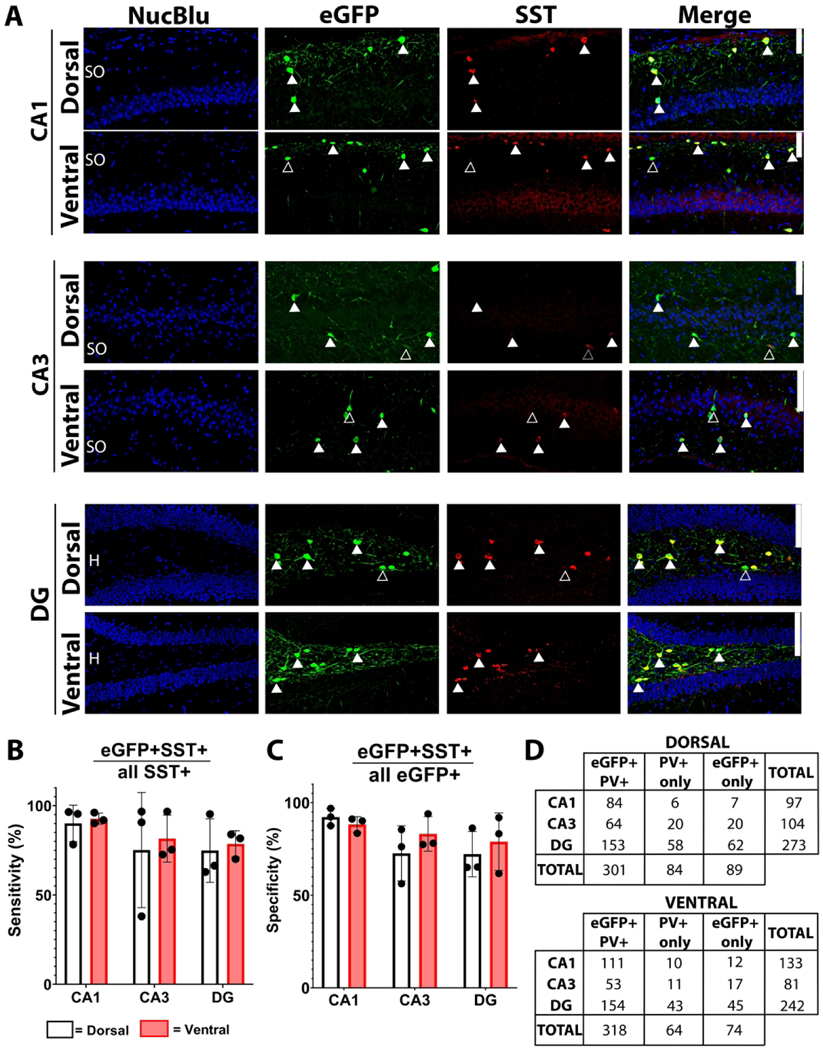
Figure 3. eGFP and SST co-expression in the hippocampus of SST;eGFP reporter mice.
A) Representative micrographs of dorsal and ventral CA1, CA3 and dentate gyrus (DG). Solid arrowheads highlight co-expressing cells, while empty arrows indicate non-co-expressing cells throughout the stratum oriens (SO), stratum pyramidale (PYR), dentate granule cell body layer (DGC-L) and hilus (H). Scale bar = 100 μm. B) Sensitivity of eGFP for SST (eGFP+SST+/all SST+). C) Specificity of eGFP for SST (eGFP+SST+/all eGFP+). D) Cell counts (n) for each condition. Bars represent mean±SEM.

