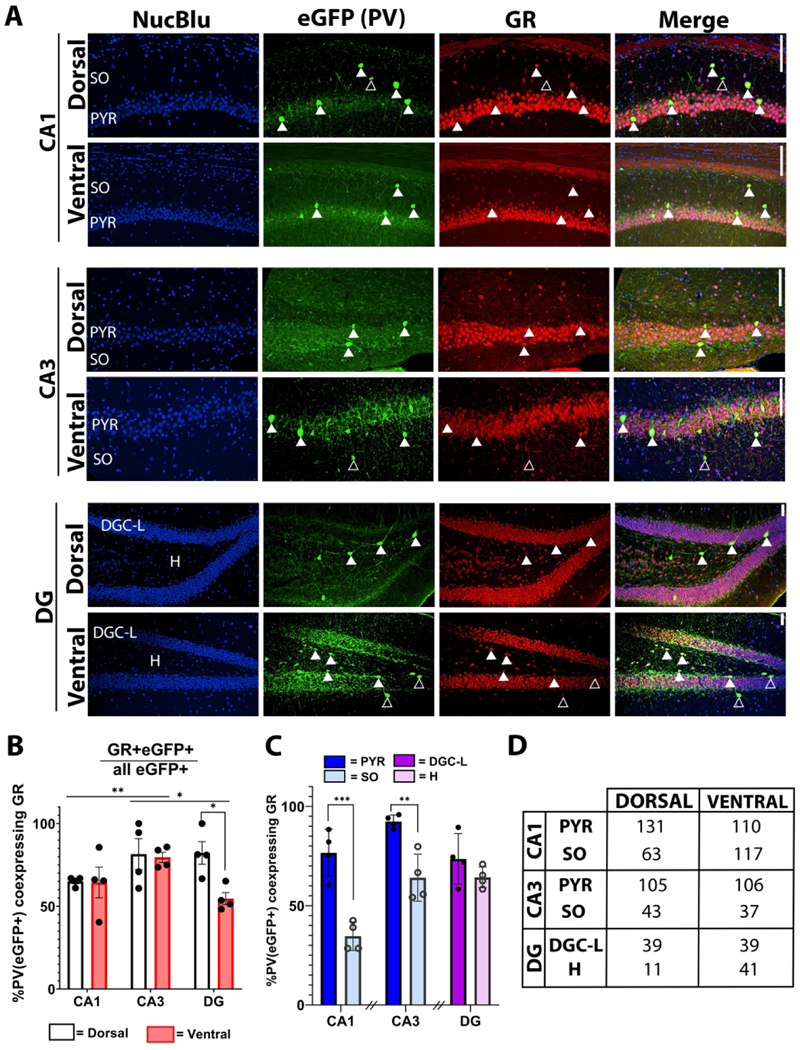
Figure 4. Hippocampal PV+ interneuron GR expression is heterogeneous.

A) Representative micrographs of PV+ interneuron GR expression in dorsal and ventral CA1, CA3 and dentate gyrus (DG). Solid arrows highlight co-expressing cells, while empty arrows indicate non-co-expressing cells throughout the stratum oriens (SO), stratum pyramidale (PYR), dentate granule cell body layer (DGC-L) and hilus (H). Scale bar = 100 μm. B) Percentage of PV+ interneurons which express GR by dorsal (white) and ventral (red) hippocampal subregion. *p<0.05, **p<0.01, ***p<0.001, main effect by two-way RM ANOVA with Bonferroni post-hoc pairwise comparison. C) Percentage of PV+ interneurons which express GR, presented by cell layer within CA1, CA3 and DG. D) Cell counts (n) for each condition. *p<0.05, **p<0.01, ***p<0.001 by Student’s t test or Mann-Whitney Rank Sum test. Breaks in the x-axis indicate groups of data which were not statistically compared. Bars represent mean±SEM.
