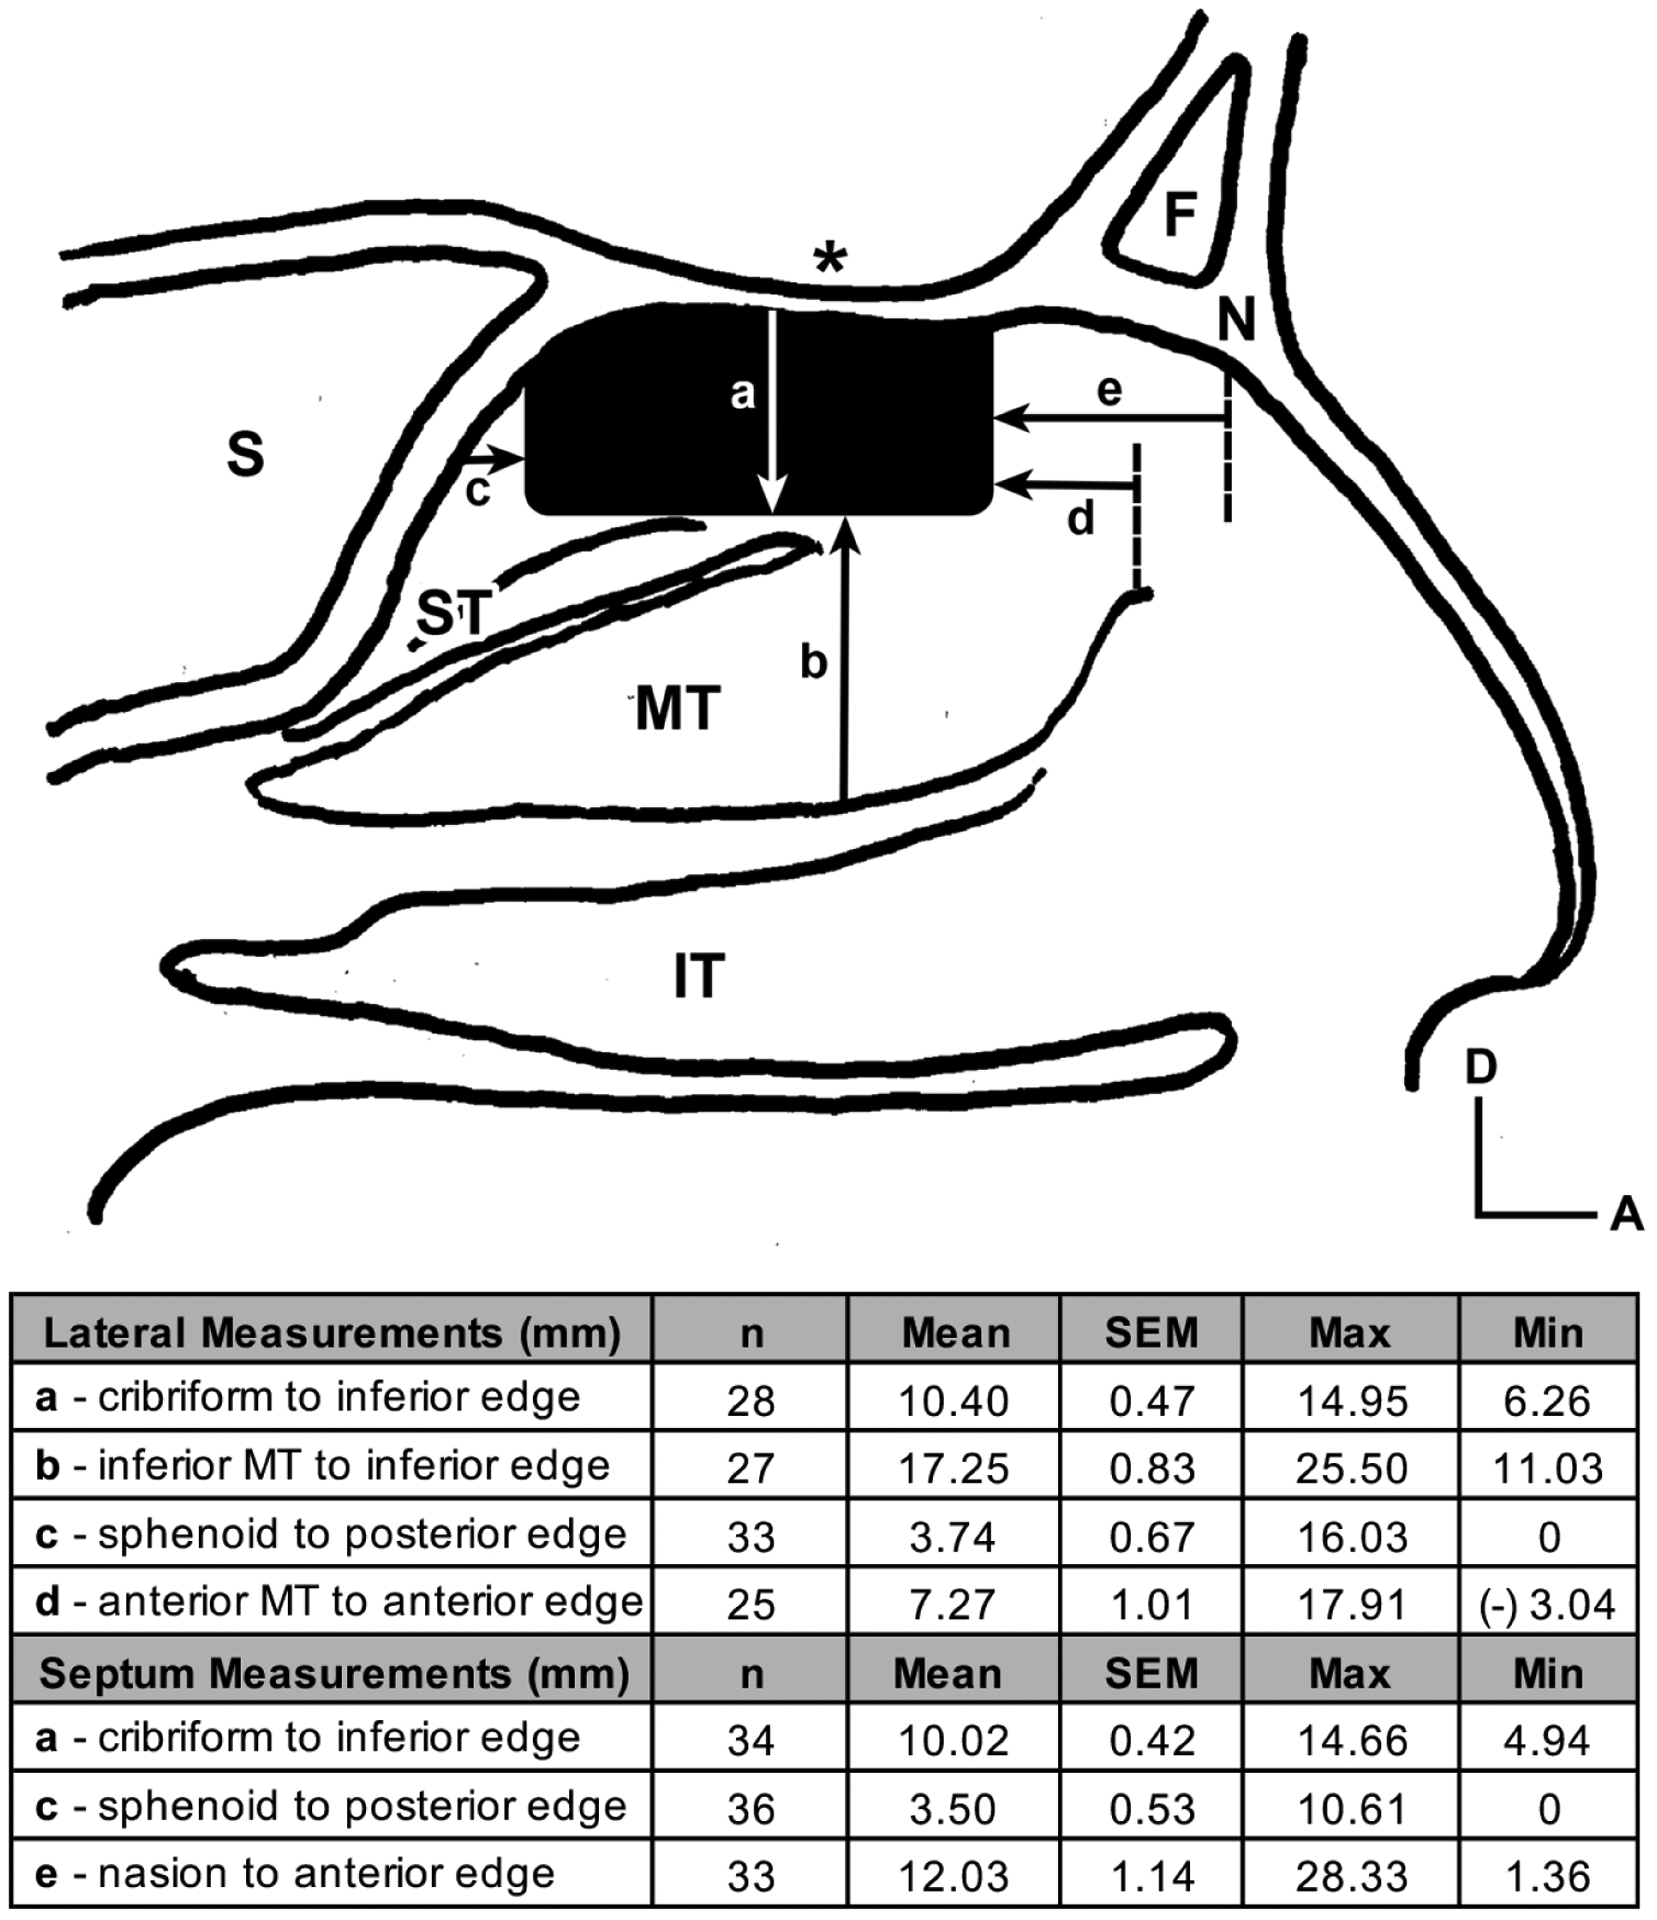
Figure 2.

Average position of the olfactory epithelium (OE) in relation to anatomic structures of the nasal cavity. The solid black rectangular shape depicts the average location of neuronal stained OE just below the cribriform plate (asterisk) in a sagittal illustration of the nasal cavity. Arrows demonstrate measurements performed on stained specimens with corresponding average values listed in the table: a = distance from the cribriform plate to the inferior boarder of OE; b = distance from the inferior boarder of the middle turbinate to the inferior boarder of the OE; c = distance from the face of the sphenoid sinus to the posterior boarder of the OE; d = distance from the anterior middle turbinate attachment to the anterior boarder of the OE; e = distance from the under surface of the nasion to the anterior OE. A = anterior; D = dorsal; F = frontal sinus; N = nasion; S = sphenoid sinus; IT = inferior turbinate; MT = middle turbinate; ST = superior turbinate
