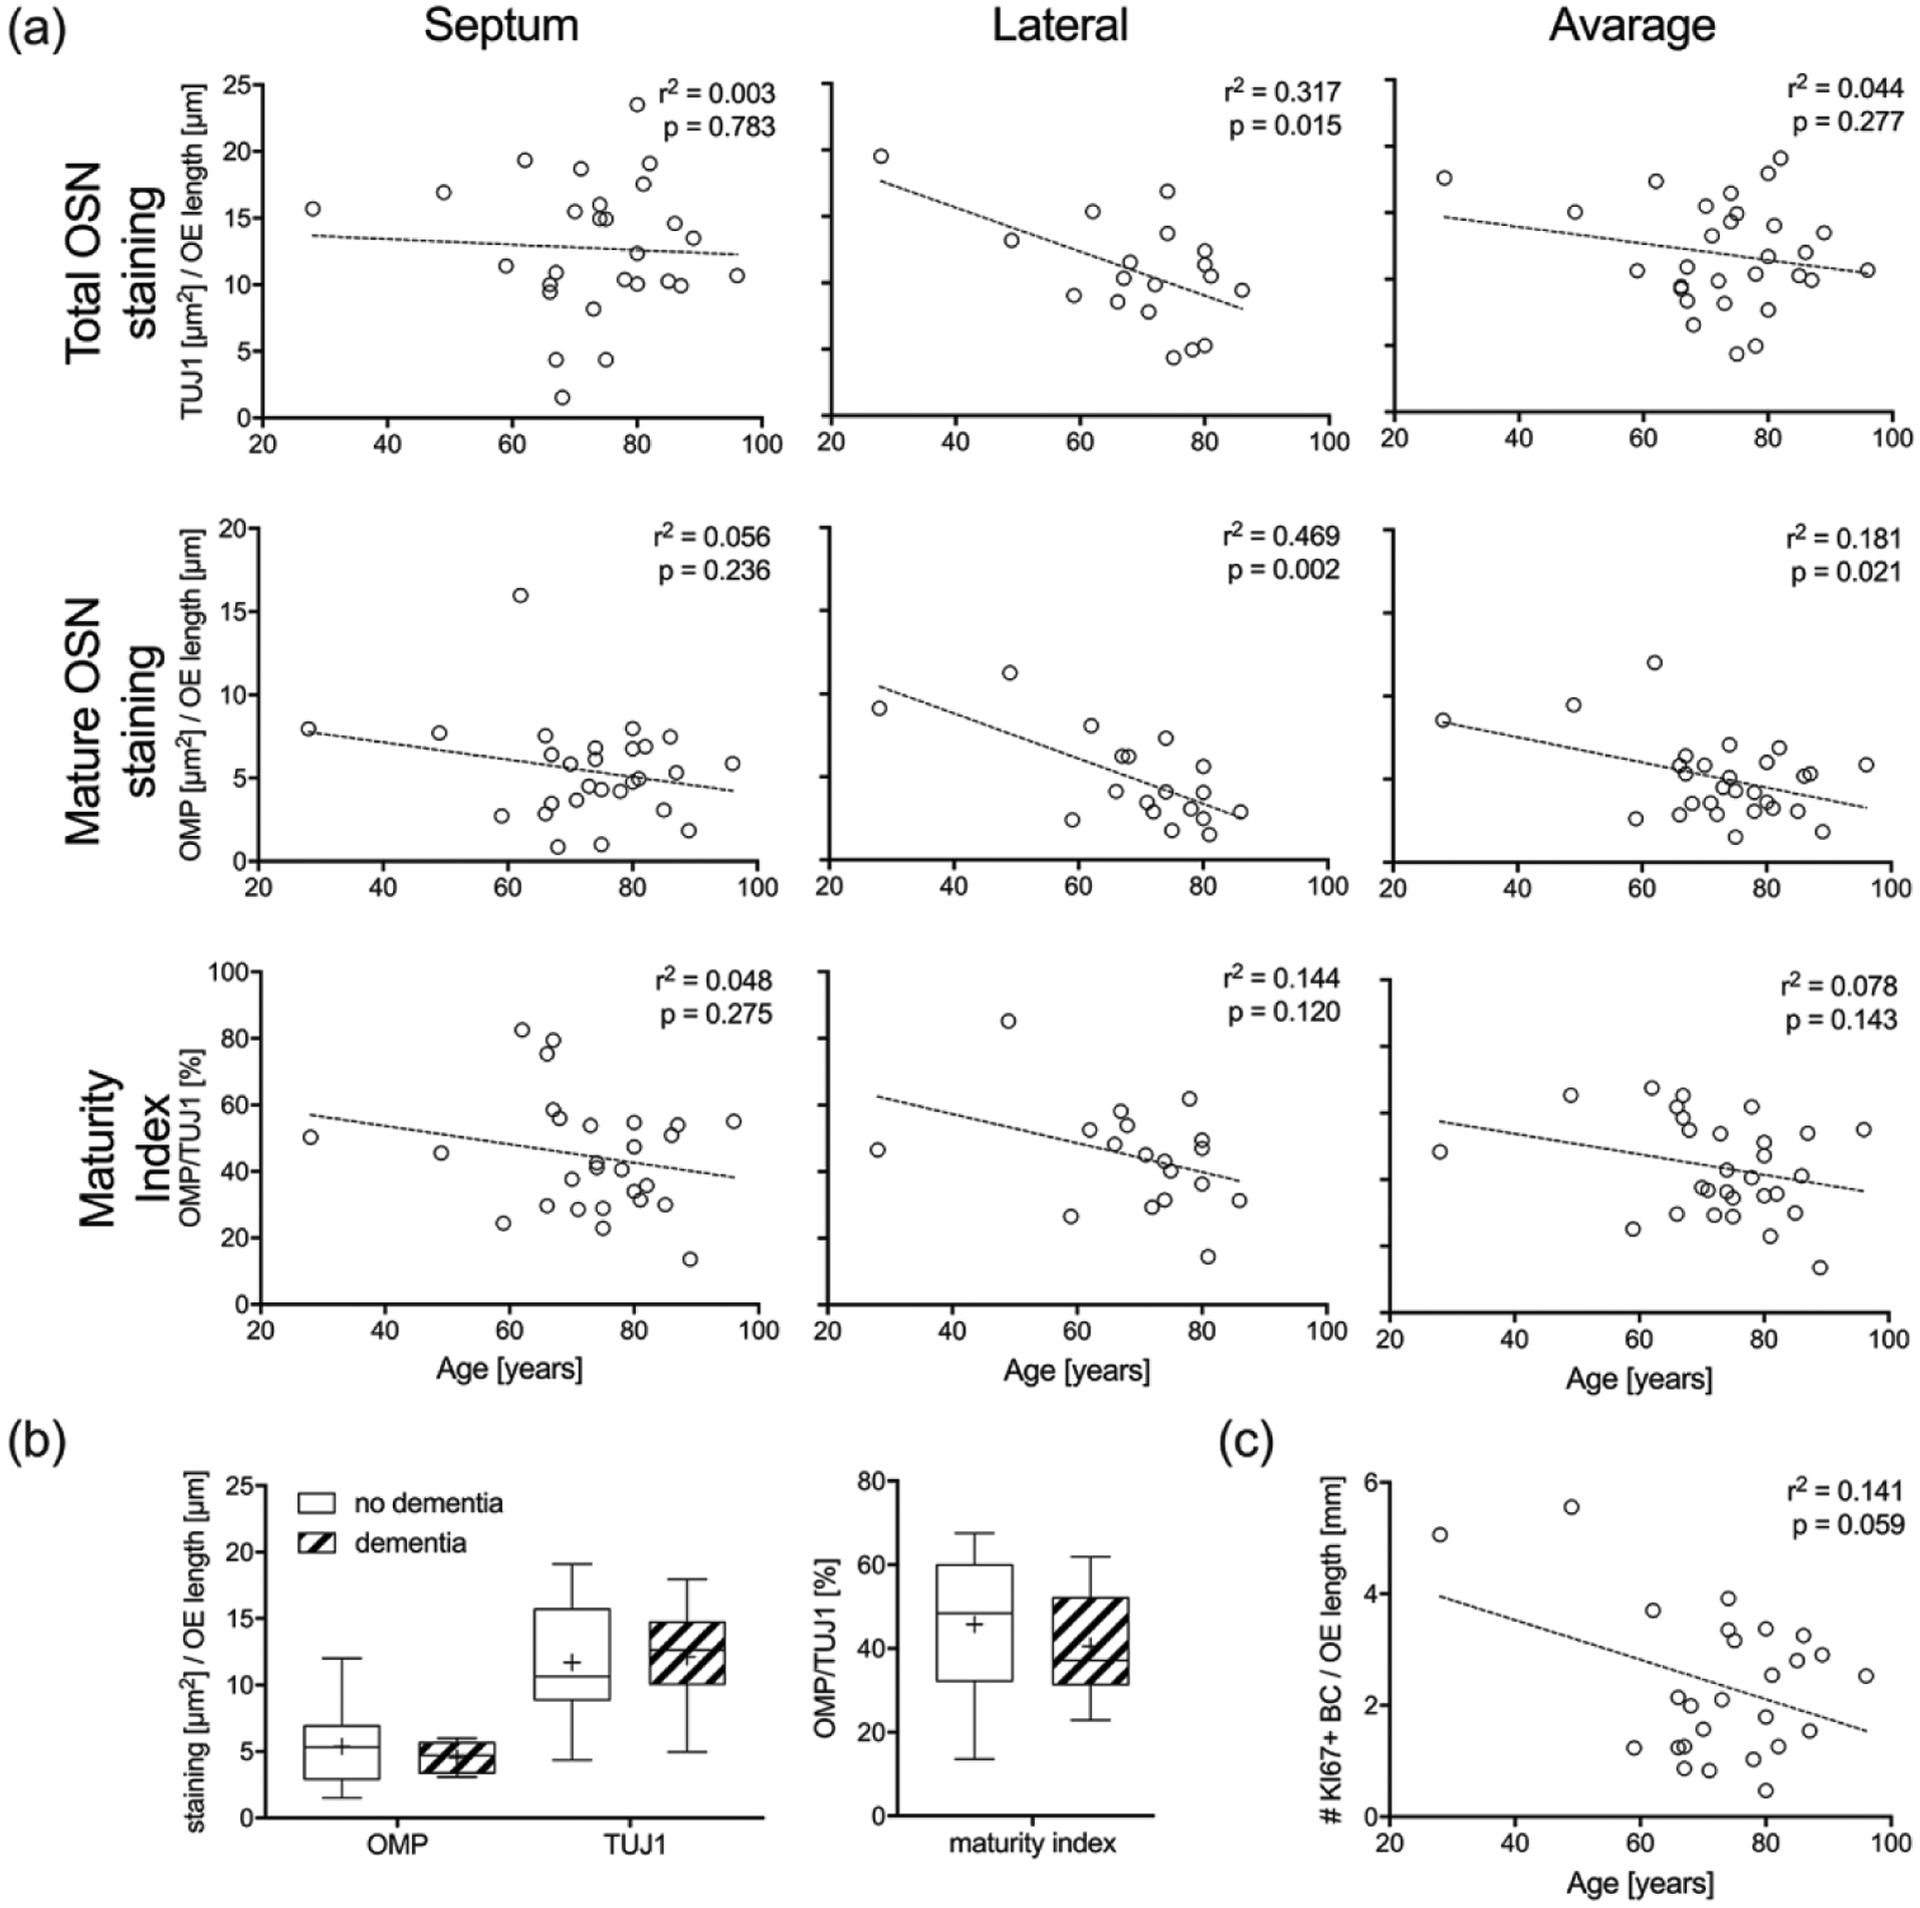
Figure 6.

Amount of mature OSNs decreases significantly with age. (a). Average amount staining from three sections through each mucosal strip taken from the septum (n = 27) and lateral wall (n = 18) below the cribriform plate were normalized to the length of OE. Linear regression curves are superimposed on scatter plots of staining versus age. Separate analyses for the septum, lateral wall, and average of both are provided for total OSNs (TUJ1 labeling), mature OSNs (OMP labeling), and maturity index (% epithelial labeling of OMP/TUJ1). (b). Boxplots of total OSNs, mature OSNs and OSN maturity index across mucosal strips obtained from the septum (n = 27) and lateral wall (n = 18) in respect to the presence or absence of dementia did not reveal significant differences. (c). Average number of dividing KI67(+)/SOX2(+) basal cells from three sections through each mucosal strip taken from the septum (n = 27) compared with age is shown using a linear regression curve.
