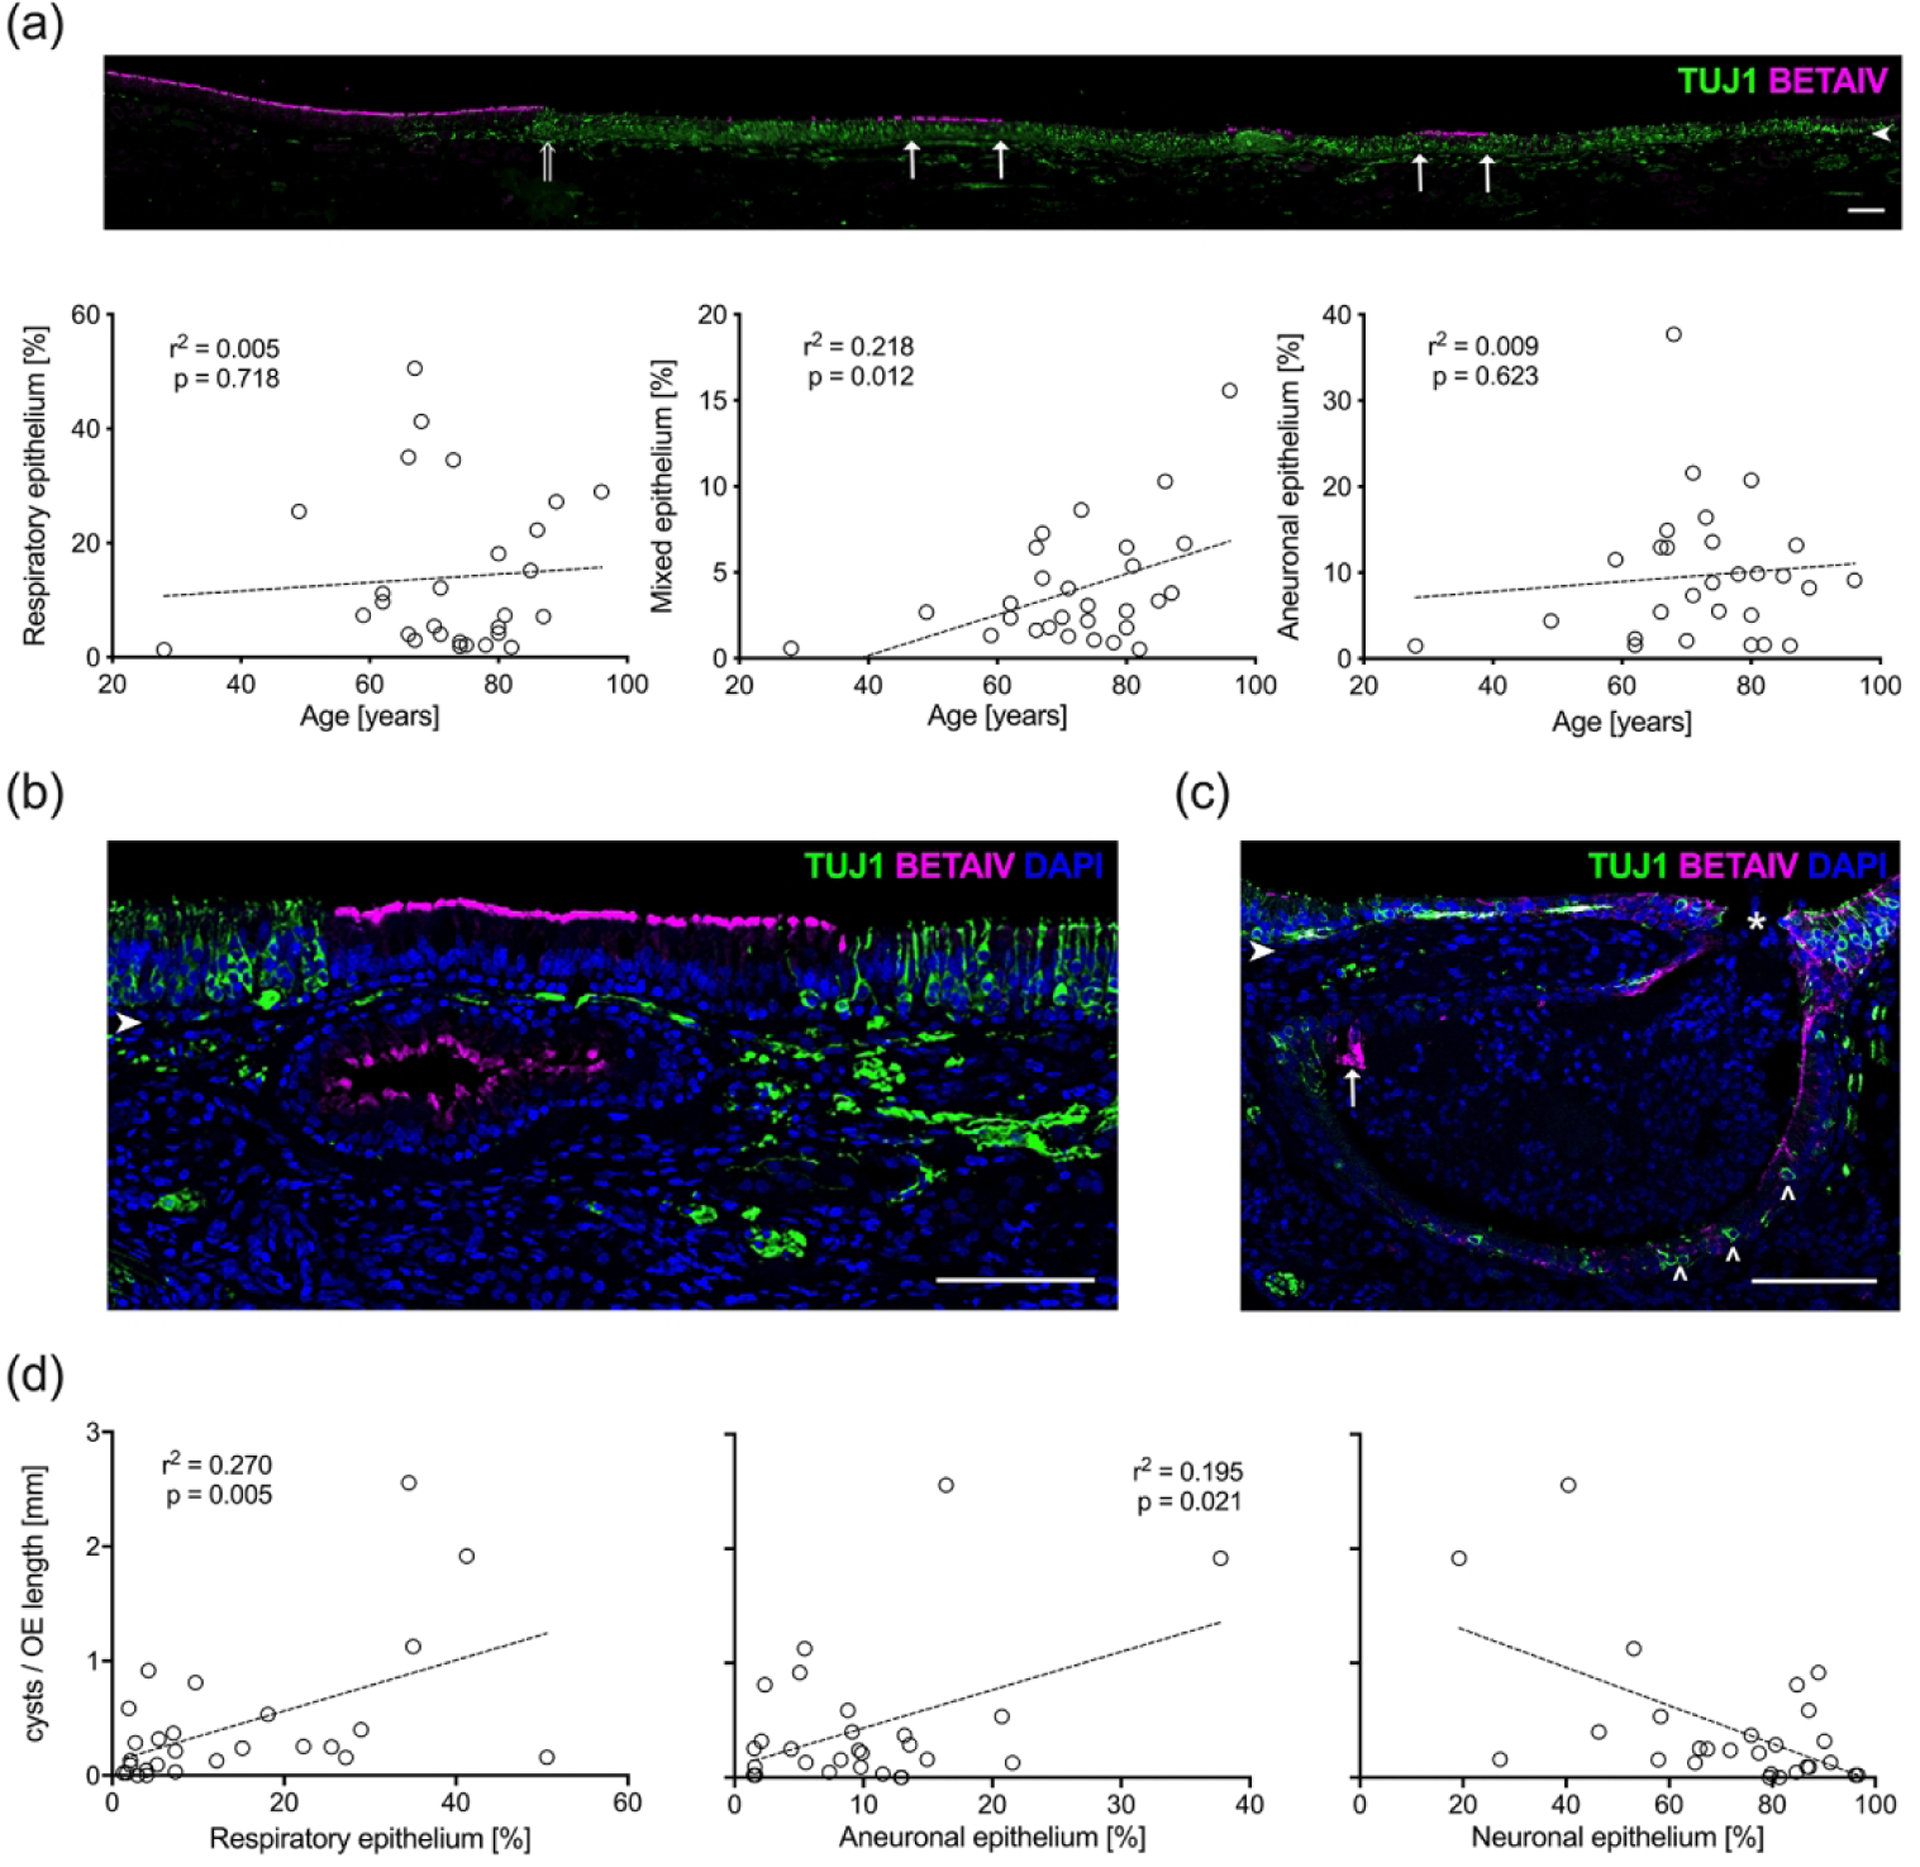
Figure 7.

Epithelial metaplasia and characteristics of subepithelial cysts correlate with age. (a). A mosaic image of a representative adult section of olfactory mucosa (#11-09008, 81 year male, left septum) stained for TUJ1(+) neurons (green) and Beta-IV(+) respiratory cilia (magenta) reveals regions of mixed epithelium (boarders defined by arrows). The transition from respiratory epithelium and OE is seen on the left (open arrow). Scale bar = 100 μm. The length of Beta-IV(+)/TUJ1(−) respiratory patches, Beta-IV(+)/TUJ1(+) mixed patches, and BetaIV(−)/TUJ1(−) aneuronal patches were normalized to the entire OE length and averaged across three equally spaced sections obtained from right and left septal mucosal strips (n = 28). Scatterplots and linear regression curves were generated as a function of age for each epithelial type. The amount of mixed epithelium correlates with advancing age. (b). A section from a 62-year-old man (#10–08058, right septum) displays a respiratory epithelia-lined submucosal cyst with Beta-IV(+) (magenta) staining of the respiratory cilia. Note the overlying epithelium is also respiratory and flanked by normal OE containing TUJ1(+) (green) OSNs. Scale bar = 100 μm. (c). A section from an 87-year-old male specimen (#08-06004, left septum) provides an example of a mixed cyst with TUJ1(+) neurons (open arrowheads) and a small area of Beta-IV(+)-respiratory epithelium (arrow) that appears to erupt through the thin overlying epithelial surface (asterisk). Scale bar = 100 μm. Arrowheads in (a), (b), and (c) indicate the basal lamina. (d). Number of cysts with true epithelial lining correlates with amount of neuronal impoverished epithelia. The total number of cysts were counted and normalized to the OE-length then averaged across three evenly spaced sections from separate septal mucosal strips (n = 28). The number of cysts per length of OE was then compared with the percent length of respiratory, neuronal and aneuronal epithelium within the OE. Corresponding scatterplots and linear regression curves reveal higher number of submucosal cysts in OEs that have higher percentages of respiratory and aneuronal epithelium. A higher percentage of neuroepithelium is related with lower number of cysts.
