Figure 8.

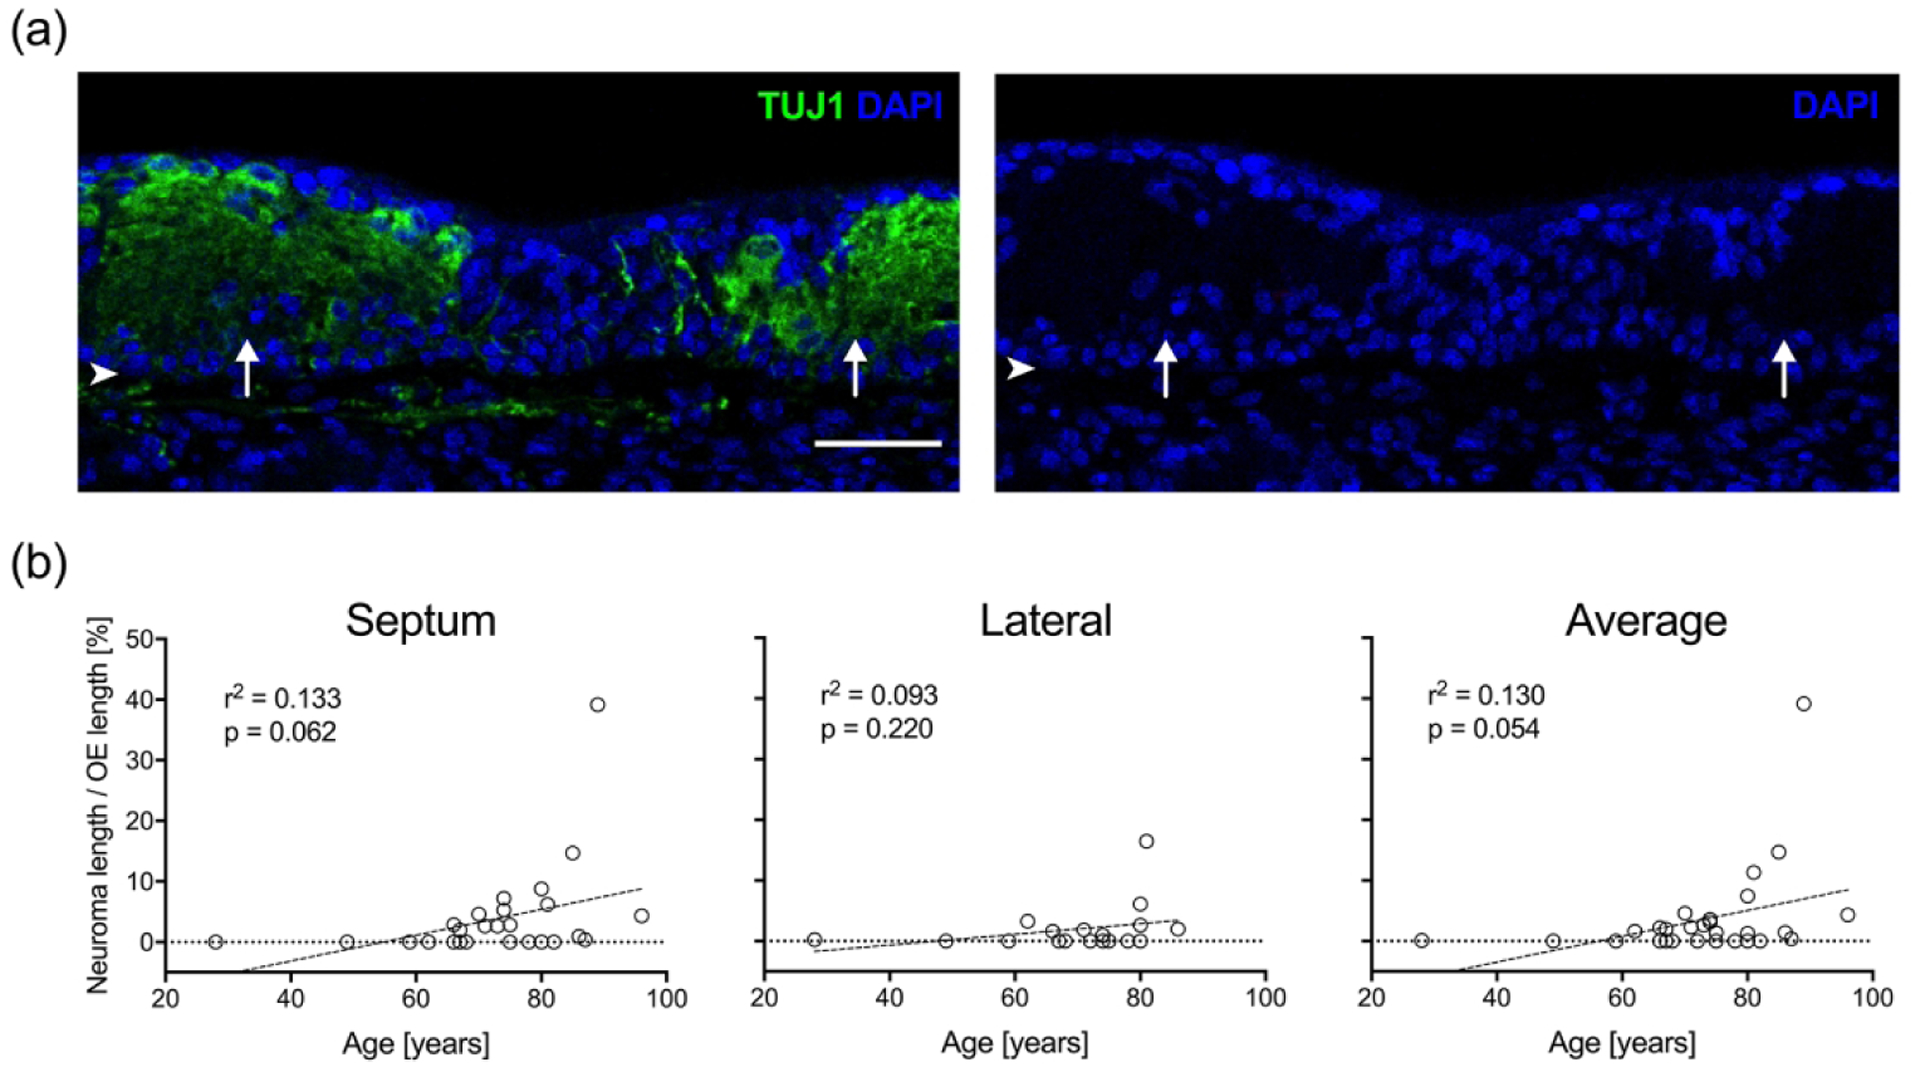
OE neuromas increase with age. (a). A section of OE from an 81-year-old male specimen (#11-09008, right septum) stained with anti-TUJ1 antibody (green) labels neuromas (arrows) within the epithelium. The area occupied by the neuromas is acellular and filled with dystrophic neurites lacking the DAPI nuclear staining (blue). Scale bar = 100 μm; arrowheads indicate the basal lamina. (b). The average cumulative length of neuromas per total OE length [%] calculated for septal and lateral mucosal strips as well as the combined septal and lateral mucosal strips from each specimen was compared with age. Scatter plots and linear regression curves demonstrate a strong trend toward increasing percent length with neurons as a function of increasing age.
