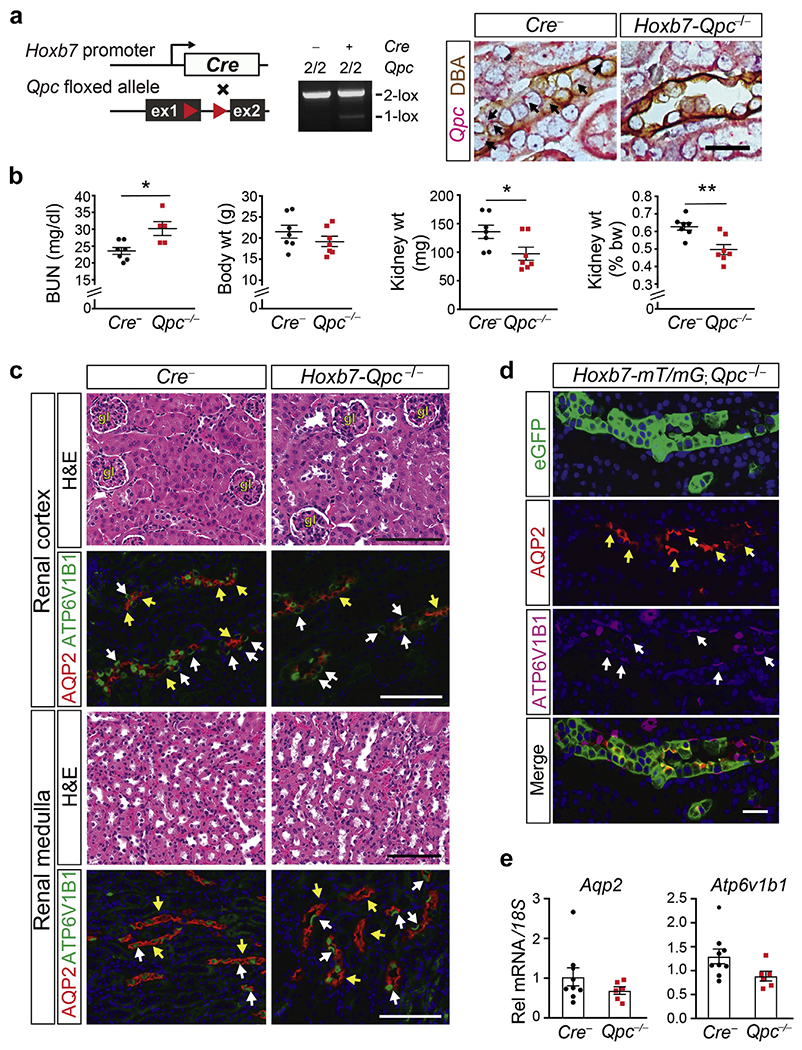
Figure 3 |. Mitochondrial electron transport is dispensable for ureteric epithelial differentiation.

(a) Schematic illustrating experimental approach and location of targeted sequences within the floxed Qpc allele; loxP sites are depicted by red arrows. Polymerase chain reaction (PCR) analysis of total genomic DNA isolated from littermate control and Hoxb7-Qpc−/− 6-week-old kidneys. The genotype of mice is indicated; the 2-lox non-recombined allele is represented by the number 2; plus and minus signs indicate the presence or absence of the Cre transgene. Right panel: Qpc mRNA detected by colorimetric RNA in situ hybridization in Cre− littermate control and Hoxb7-Qpc−/− kidneys. Kidney sections were costained with dolichos biflorus agglutinin (DBA) lectin; the black arrows depict Qpc transcripts (red signal). Bar = 25 μm. (b) Blood urea nitrogen (BUN), total body weight (wt), kidney weight, and kidney/body weight ratio for control and Hoxb7-Qpc−/− mutants at age 6 weeks (n = 7). (c) Representative hematoxylin and eosin (H&E) and immunofluorescence (IF) images of kidney sections from 6-week-old control and Hoxb7-Qpc−/− mice. IF staining for collecting duct markers aquaporin 2 (AQP2) and ATPase H+ transporting V1 subunit B1 (ATP6V1B1). The yellow arrows depict AQP2+ cells, and the white arrows identify ATP6V1B1+ cells. Bar = 100 μm. (d) Representative images of kidney sections from 6-week-old Hoxb7-mT/mG;Qpc−/− mice stained by IF for enhanced green fluorescent protein (eGFP), AQP2, and ATP6V1B1; the yellow arrows depict AQP2+ cells, and the white arrows identify ATP6V1B1+ cells; the presence of eGFP indicates recombination of the Cre reporter allele (mT/mG). Bar = 25 μm. (e) Analysis of Aqp2 and Atp6v1b1 transcript levels in kidneys from 6-week-old Cre− littermate control and Hoxb7-Qpc−/− kidneys by quantitative real-time PCR (n = 6–8). Data are expressed as mean ± SEM; Student’s t test, 2-tailed, *P < 0.05, **P < 0.01. 18S, 18S ribosomal RNA; Rel, relative. To optimize viewing of this image, please see the online version of this article at www.kidney-international.org.
