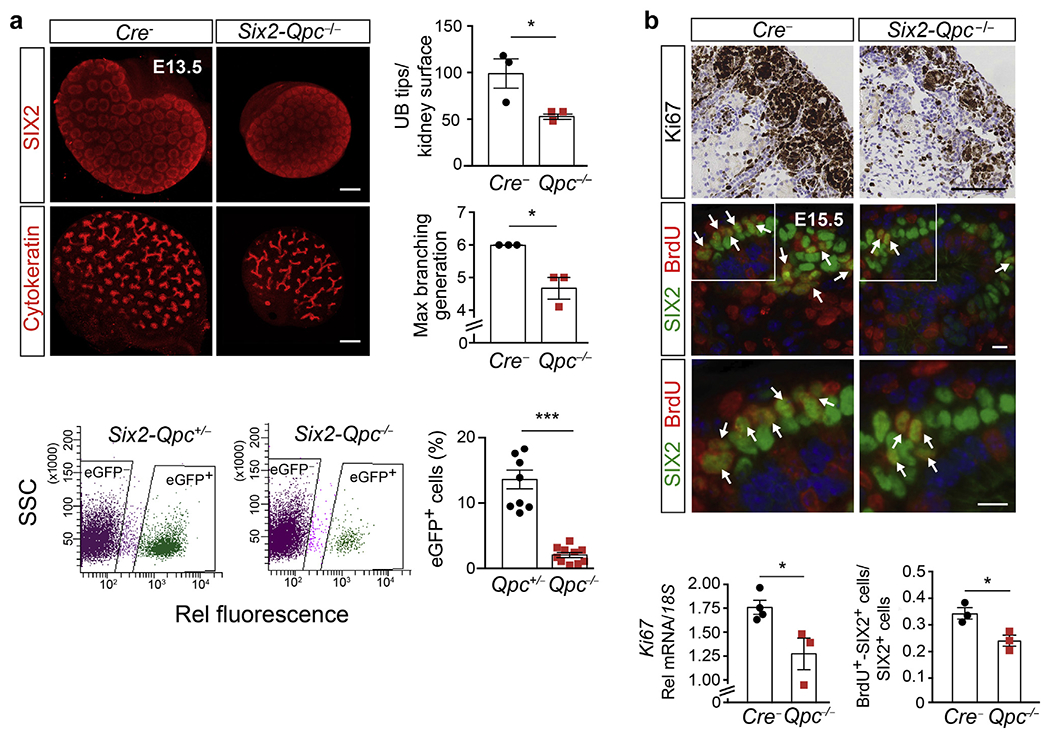
Figure 5 |. SIX2 progenitor proliferation is reduced in Six2-Qpc−/− kidneys.

(a) Representative immunofluorescence (IF) images of whole mounts from Cre− littermate control and mutant Six2-Qpc−/− kidneys at age embryonic day (E) 13.5, stained for SIX2 and cytokeratin. Shown on the right are ureteric bud (UB) tip numbers per kidney surface and maximal branching generations per kidney in control and mutant mice. Bar = 500 μm. Lower panels: quantification of Six2-eGFP/cre–expressing cells (eGFP+) inheterozygous control (Six2-Qpc+/−) and mutant Six2-Qpc−/− kidneys at age E18.5. The number of eGFP+ cells is expressed as percentage of the total number of cells analyzed by fluorescence-activated cell sorting. Gating for Six2-Qpc+/− and Six2-Qpc−/− is shown on the right. The possibility of capturing differentiating Qpc+/− cells with low GFP expression cannot be completely excluded. (b) Right upper panels: proliferative activity in Six2-Qpc−/− kidneys, assessed by Ki67 immunohistochemistry (IHC) at age postnatal day 0 and bromodeoxyuridine (BrdU) labeling at age E15.5. The white arrows depict cells double positive for BrdU and SIX2. Right lower panels: Ki67 transcript levels in whole kidney homogenates and ratio of BrdU/SIX2 double-positive cells (SIX2+BrdU+) to total number of SIX2+ cells in control and mutant kidneys. Bar = 100 μm for Ki67 IHC images, and Bar = 10 μm for BrdU IF images. Data are expressed as mean ± SEM; Student’s t test, 2-tailed, *P < 0.05 and ***P < 0.001. 18S, 18S ribosomal RNA; Rel, relative. To optimize viewing of this image, please see the online version of this article at www.kidney-international.org.
