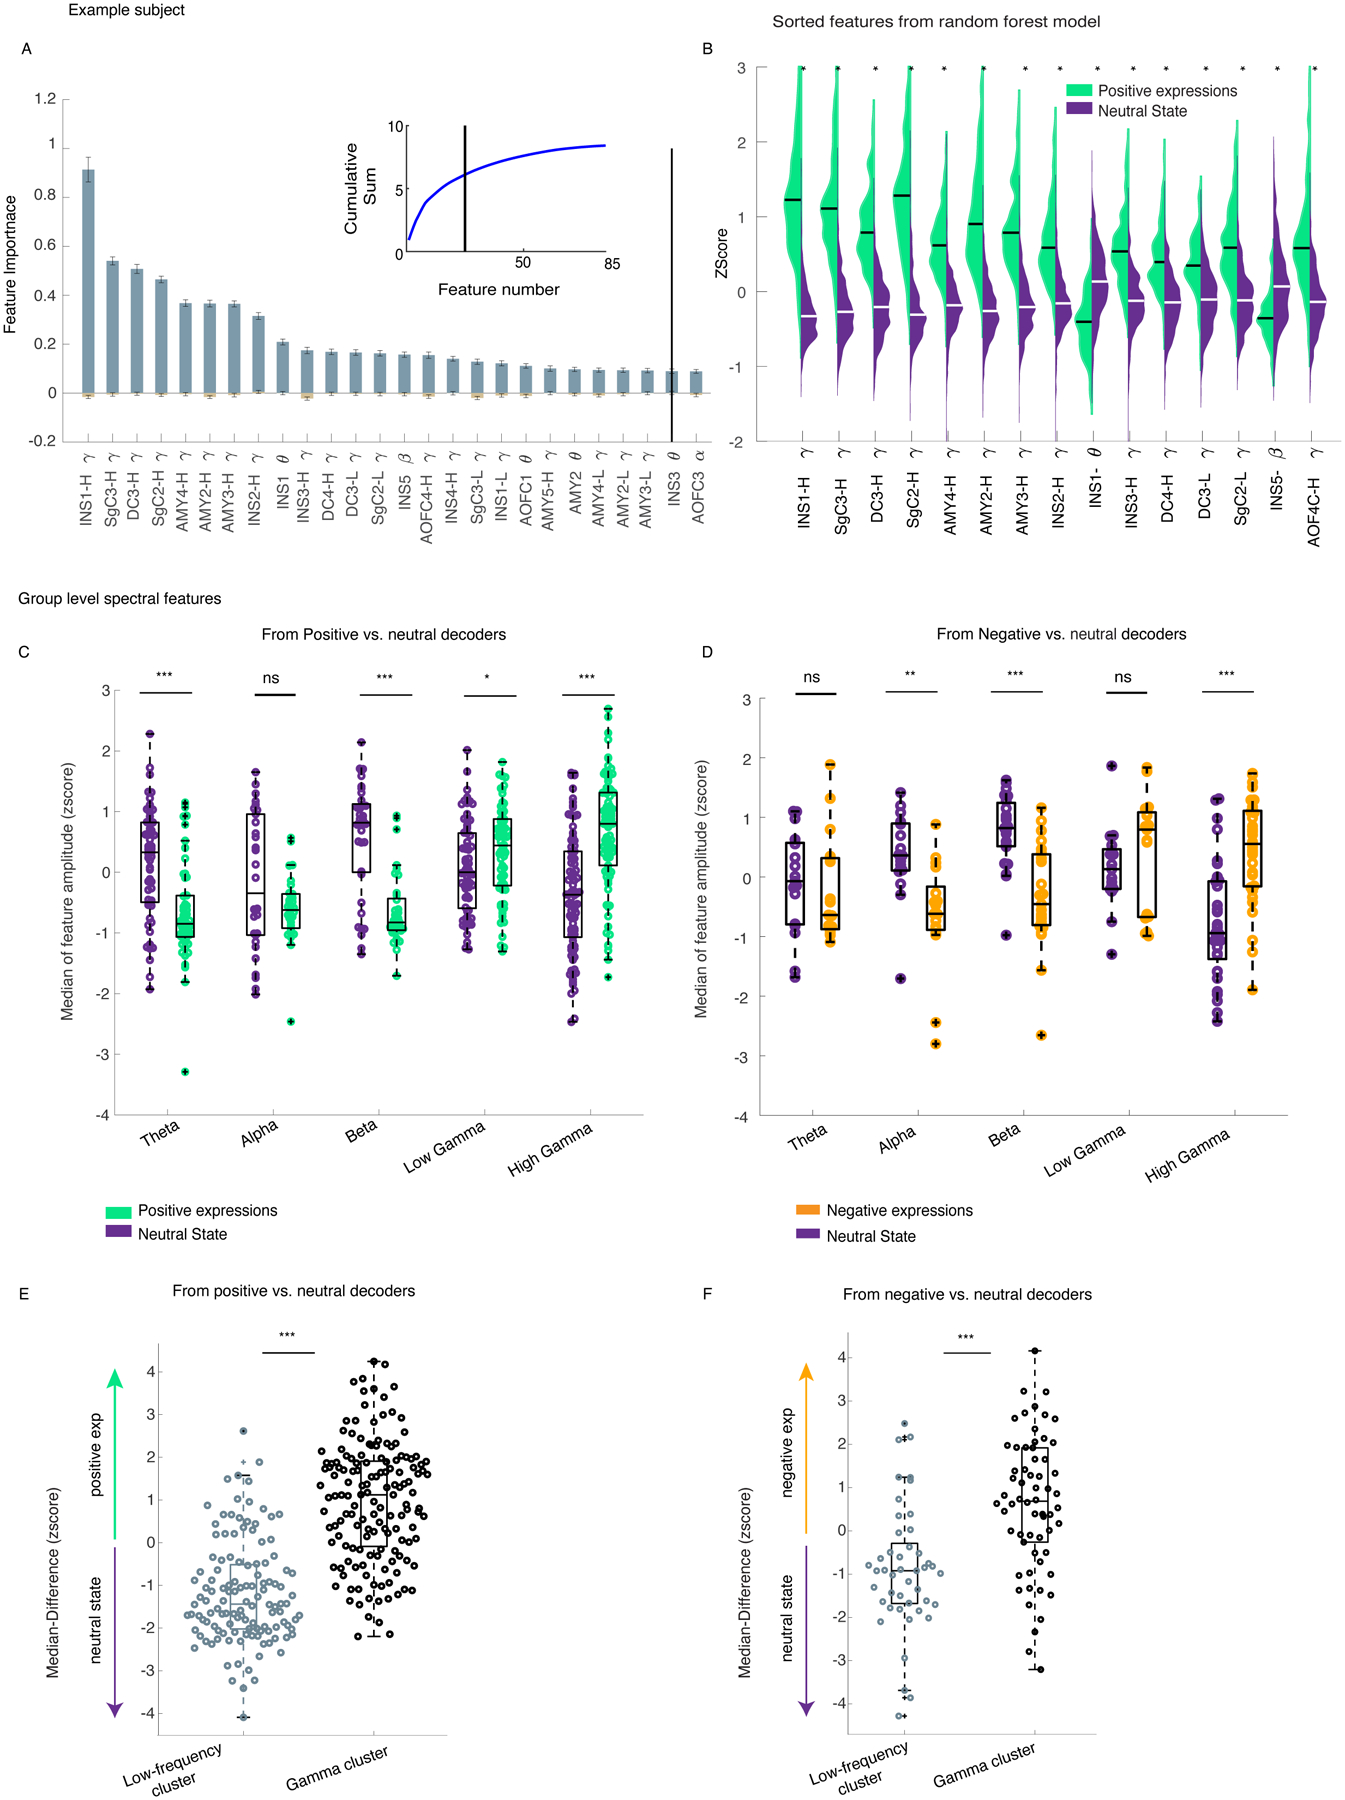
Figure 3. There was increased gamma band (low and high) activity during affective behaviors compared to neutral behaviors.

A) The feature importance across n=100 dataset/runs from the positive decoders is shown for the example participant (Subject 1); Data are presented as mean values +/− SEM. The inset shows the cumulative summation curve of the average feature importance value across the runs; the black vertical lines are the objective threshold that was used to select the top features. B) The sample distributions of the top 15 selected features for the positive affective behaviors (green) and neutral behaviors (purple) are provided. All sample distributions were significantly different from each other(p<0.0001). C) The normalized median distributions of the positive affective behaviors and the neutral behaviors are shown for selected features across the sample. The median values from the positive decoders were first normalized to the maximum absolute spectral amplitude across selected features at a within-subject level and then pooled across all participants (n = 10). The median values from the positive affective behaviors were significantly different from the neutral behaviors within theta (n=55, p=9 * 10−6), beta (n=37, p=10−6), low gamma (n= 65, p= 0.043), and high gamma bands (n=86, p=10−9). D) The normalized median distributions of negative affective behaviors and neutral behaviors are shown for selected features (from five participants). The median values were significantly different within alpha (n=17, p=0.0004), beta (n=23, p=6 * 10−5), and high gamma (n= 33, p=10−5). E) The median difference score of the gamma cluster was selective to positive(n=149) and F) negative affective(n=62) behaviors. The low-frequency cluster (n=124 for positive, n=45 for negative decoders) is significantly different from the gamma cluster for both positive (panel E, p= 10−26) and negative decoders (panel F, p=3 * 10−6). All pairwise statistical comparisons are based on non-parametric two-sided ranksum test (B-F). In the box plots(C-F) central lines represent the median and the two edges represent 25 and 75 percentiles, whiskers show the most extreme datapoints and outliers are shown individually (see MATLAB boxplot function). INS: insula, SgC = Subgenual cingulate, DC = dorsal cingulate, AMY: amygdala. H = high, L = low.
