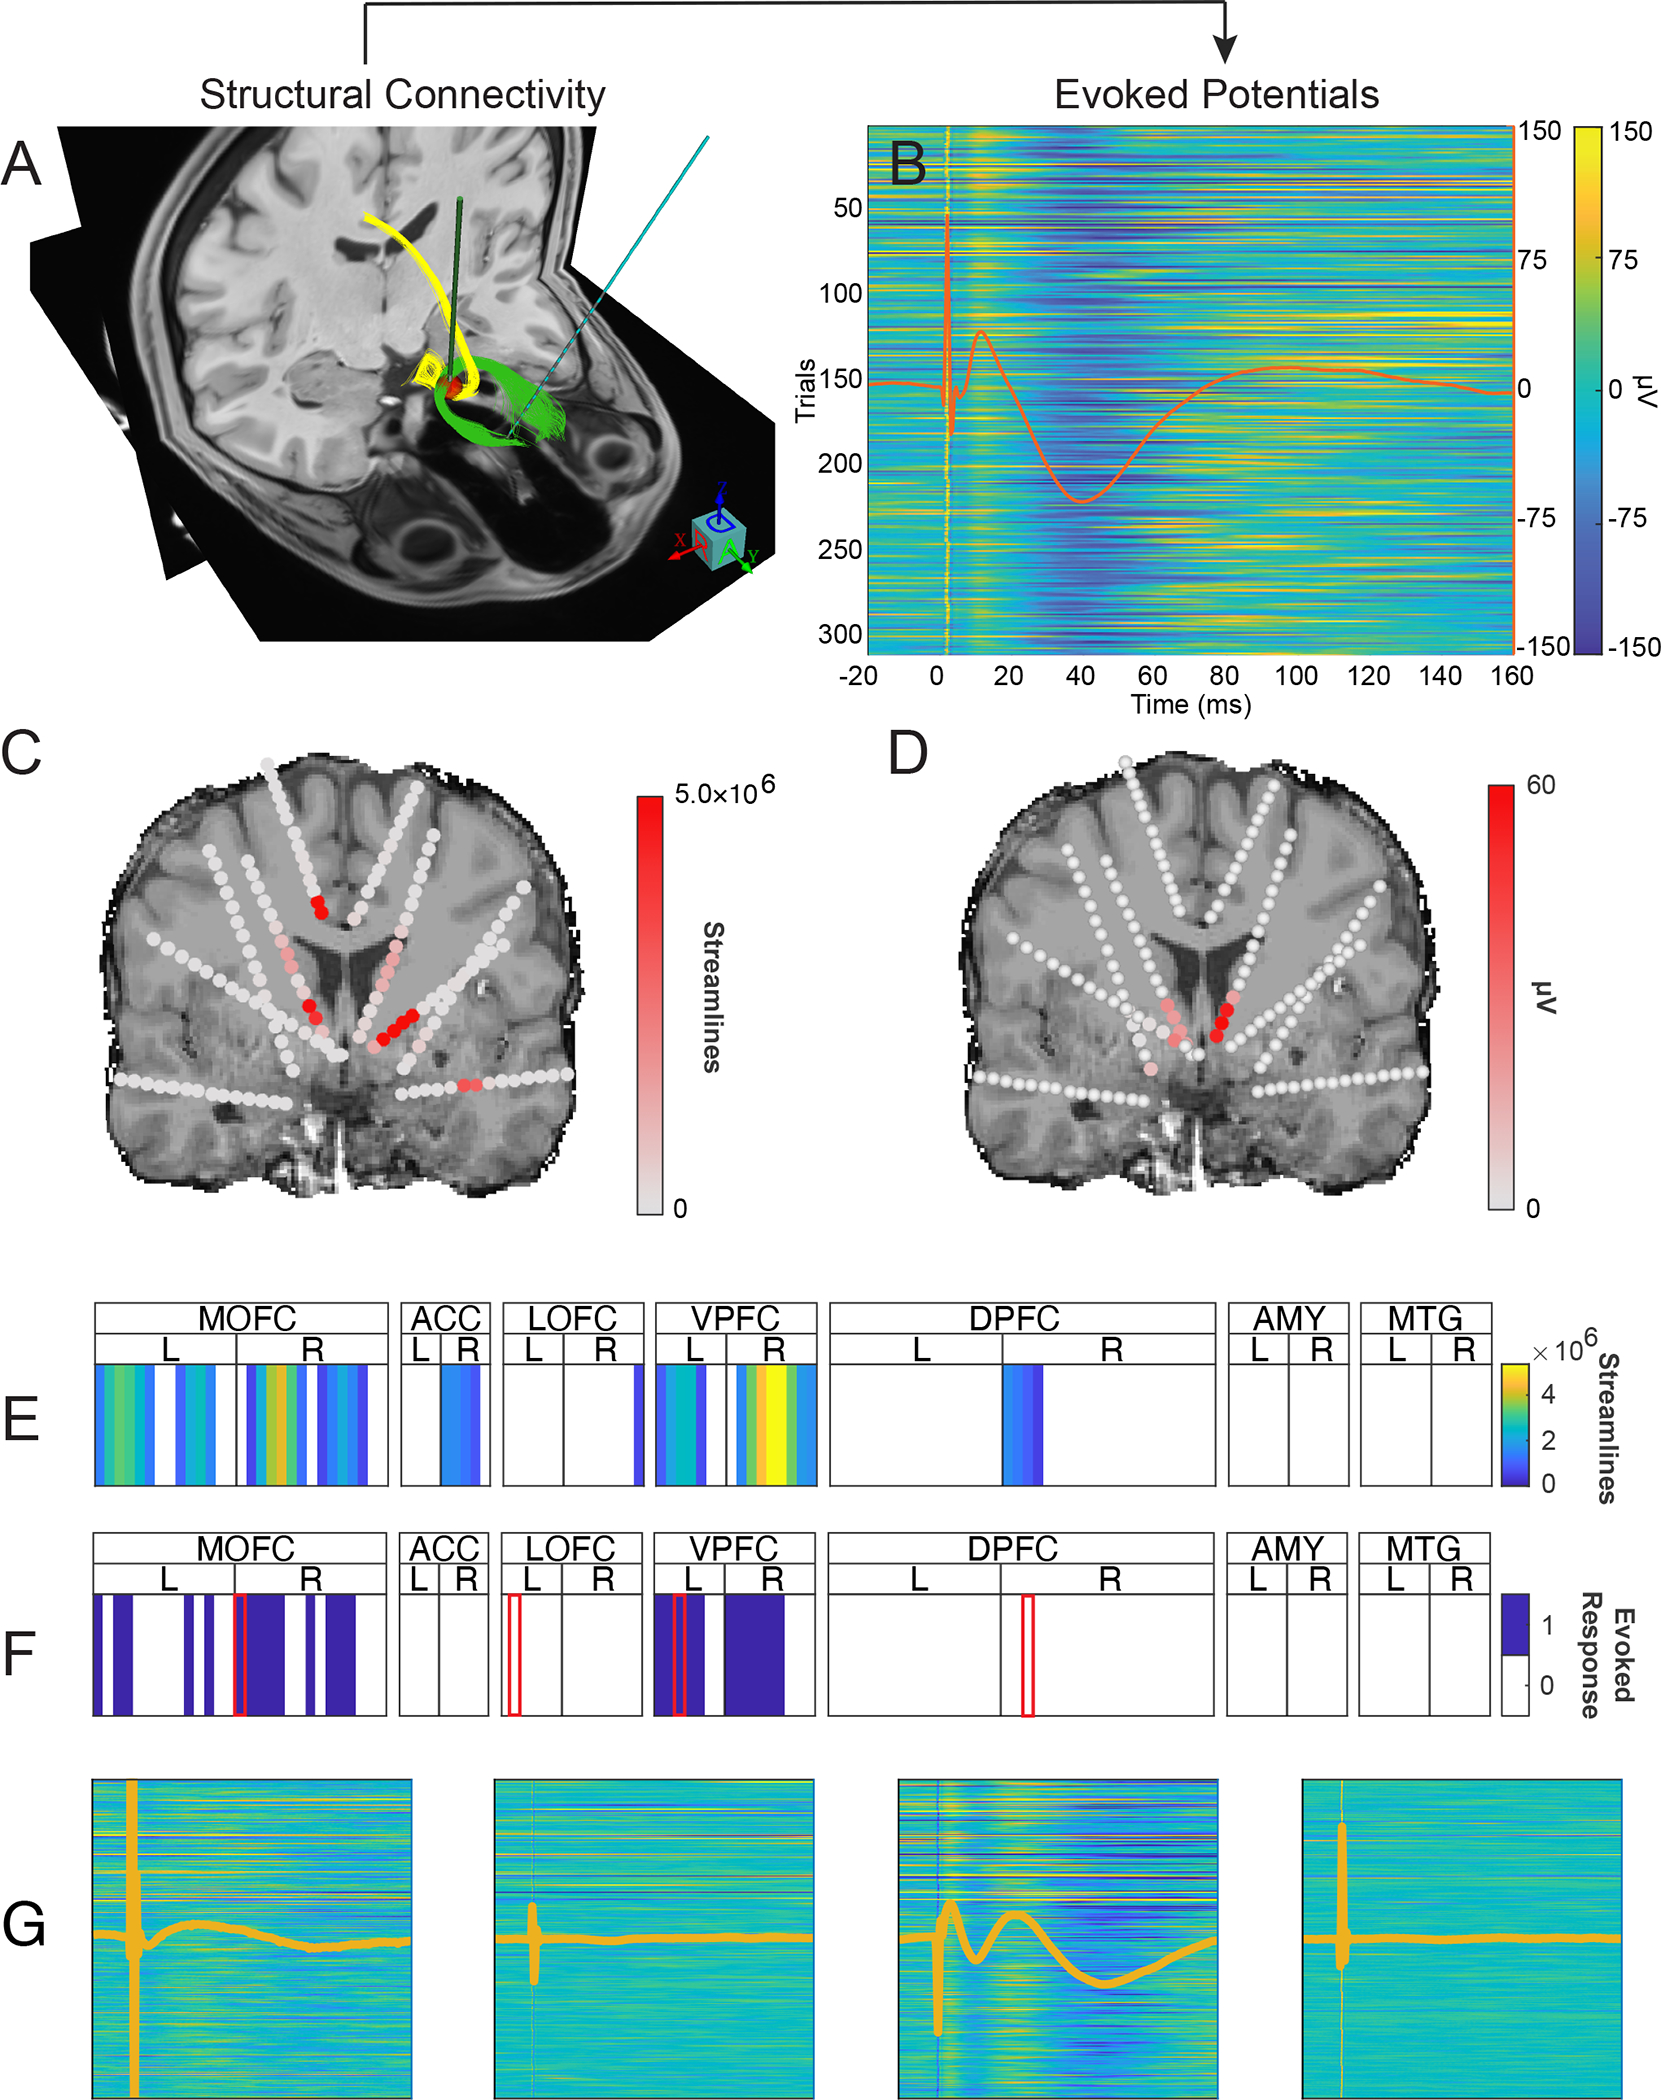
Figure 2: Example of evoked potential and streamline analysis for a single stimulation volume.

Two treatment-resistant depression patients underwent neurosurgical treatment involving DBS. We compare tractography from pre-surgical MRI to post-surgical in vivo recordings. (A) Given the stimulation volume of interest as Right SCC monopolar stacked segmented contacts 4 and 7, (red sphere) the diffusion tractography to the whole brain is performed and intersection with the sEEG contact of interest (Left OFC contact 3) is calculated. (B) 315 single-pulse stimulation trials are applied to the Right SCC monopolar contacts 4 and 7, and evoked potentials are measured at the same sEEG contact as measured via streamlines in Panel A. (C&E) The process is repeated to calculate the number of streamlines intersecting all sEEG contacts in the brain. (D&F) Evoked potentials arising from RSCC 4–7 stimulation are calculated from all sEEG contacts. Warmer colors indicated greater numbers of streamlines (Panel C) and higher voltage evoked potentials averaged across 315 trials (Panel D). These data are reduced to a single row, with white cells represent targets with less than 500,000 streamlines (Panel E) and contacts where no evoked potential waveform was detected (Panel F). (G) Four exemplar traces derived from single-pulse stimulation. Traces have the same scaling as (B) and are associated from left-to-right with the contacts indicated by a red border in Panel F.
