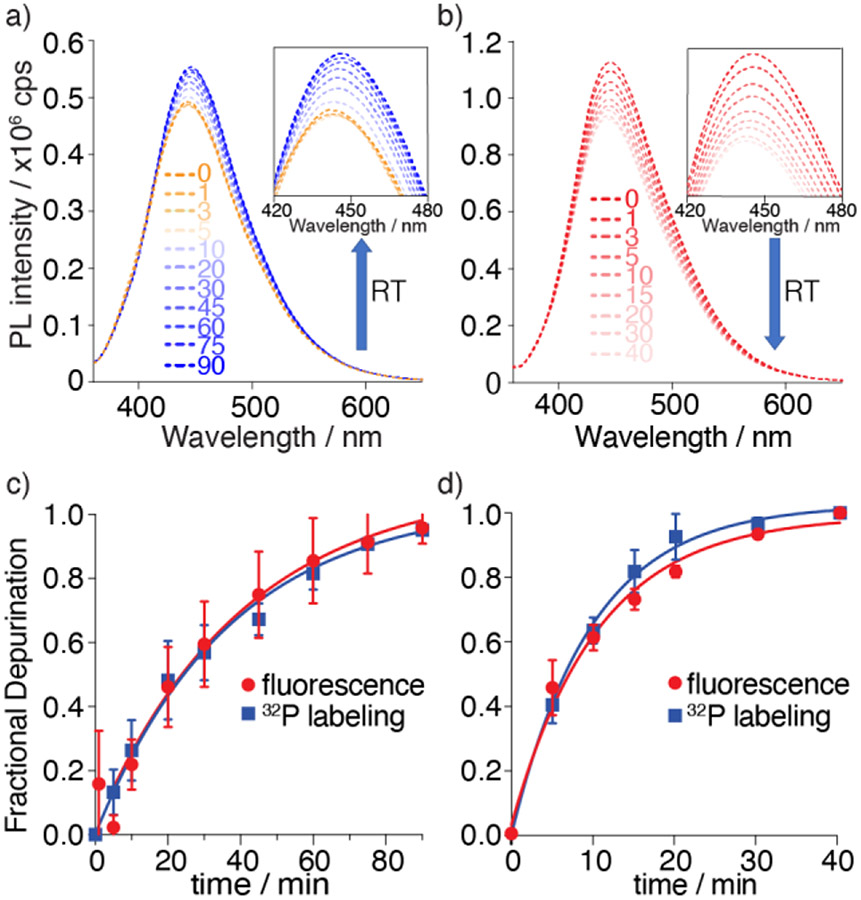
Figure 5.
Top: Saporin-mediated depurination reaction of substrate R1a and R1b monitored by fluorescence as function of reaction time (RT), respectively. a) Emission spectra of depurination reaction of tzG substrate R1a. Excitation wavelength was 351 nm. Inset: Emission from 420 to 480 nm b) Emission spectra of depurination reaction of thG substrate R1b. Excitation wavelength was 351 nm. Inset: Emission from 420 to 480 nm. The area of each spectrum was integrated and plotted vs. time to yield the kinetics of the enzymatic reaction (c,d). c) Fractional depurination of R1a by saporin at various time points monitored by fluorescence (red) and 32P radiolabeling (blue). d) Fractional depurination of R1b by saporin at various time points monitored by fluorescence (red) and 32P radiolabeling (blue). Assays were done in triplicates. Error bars indicate SD.

