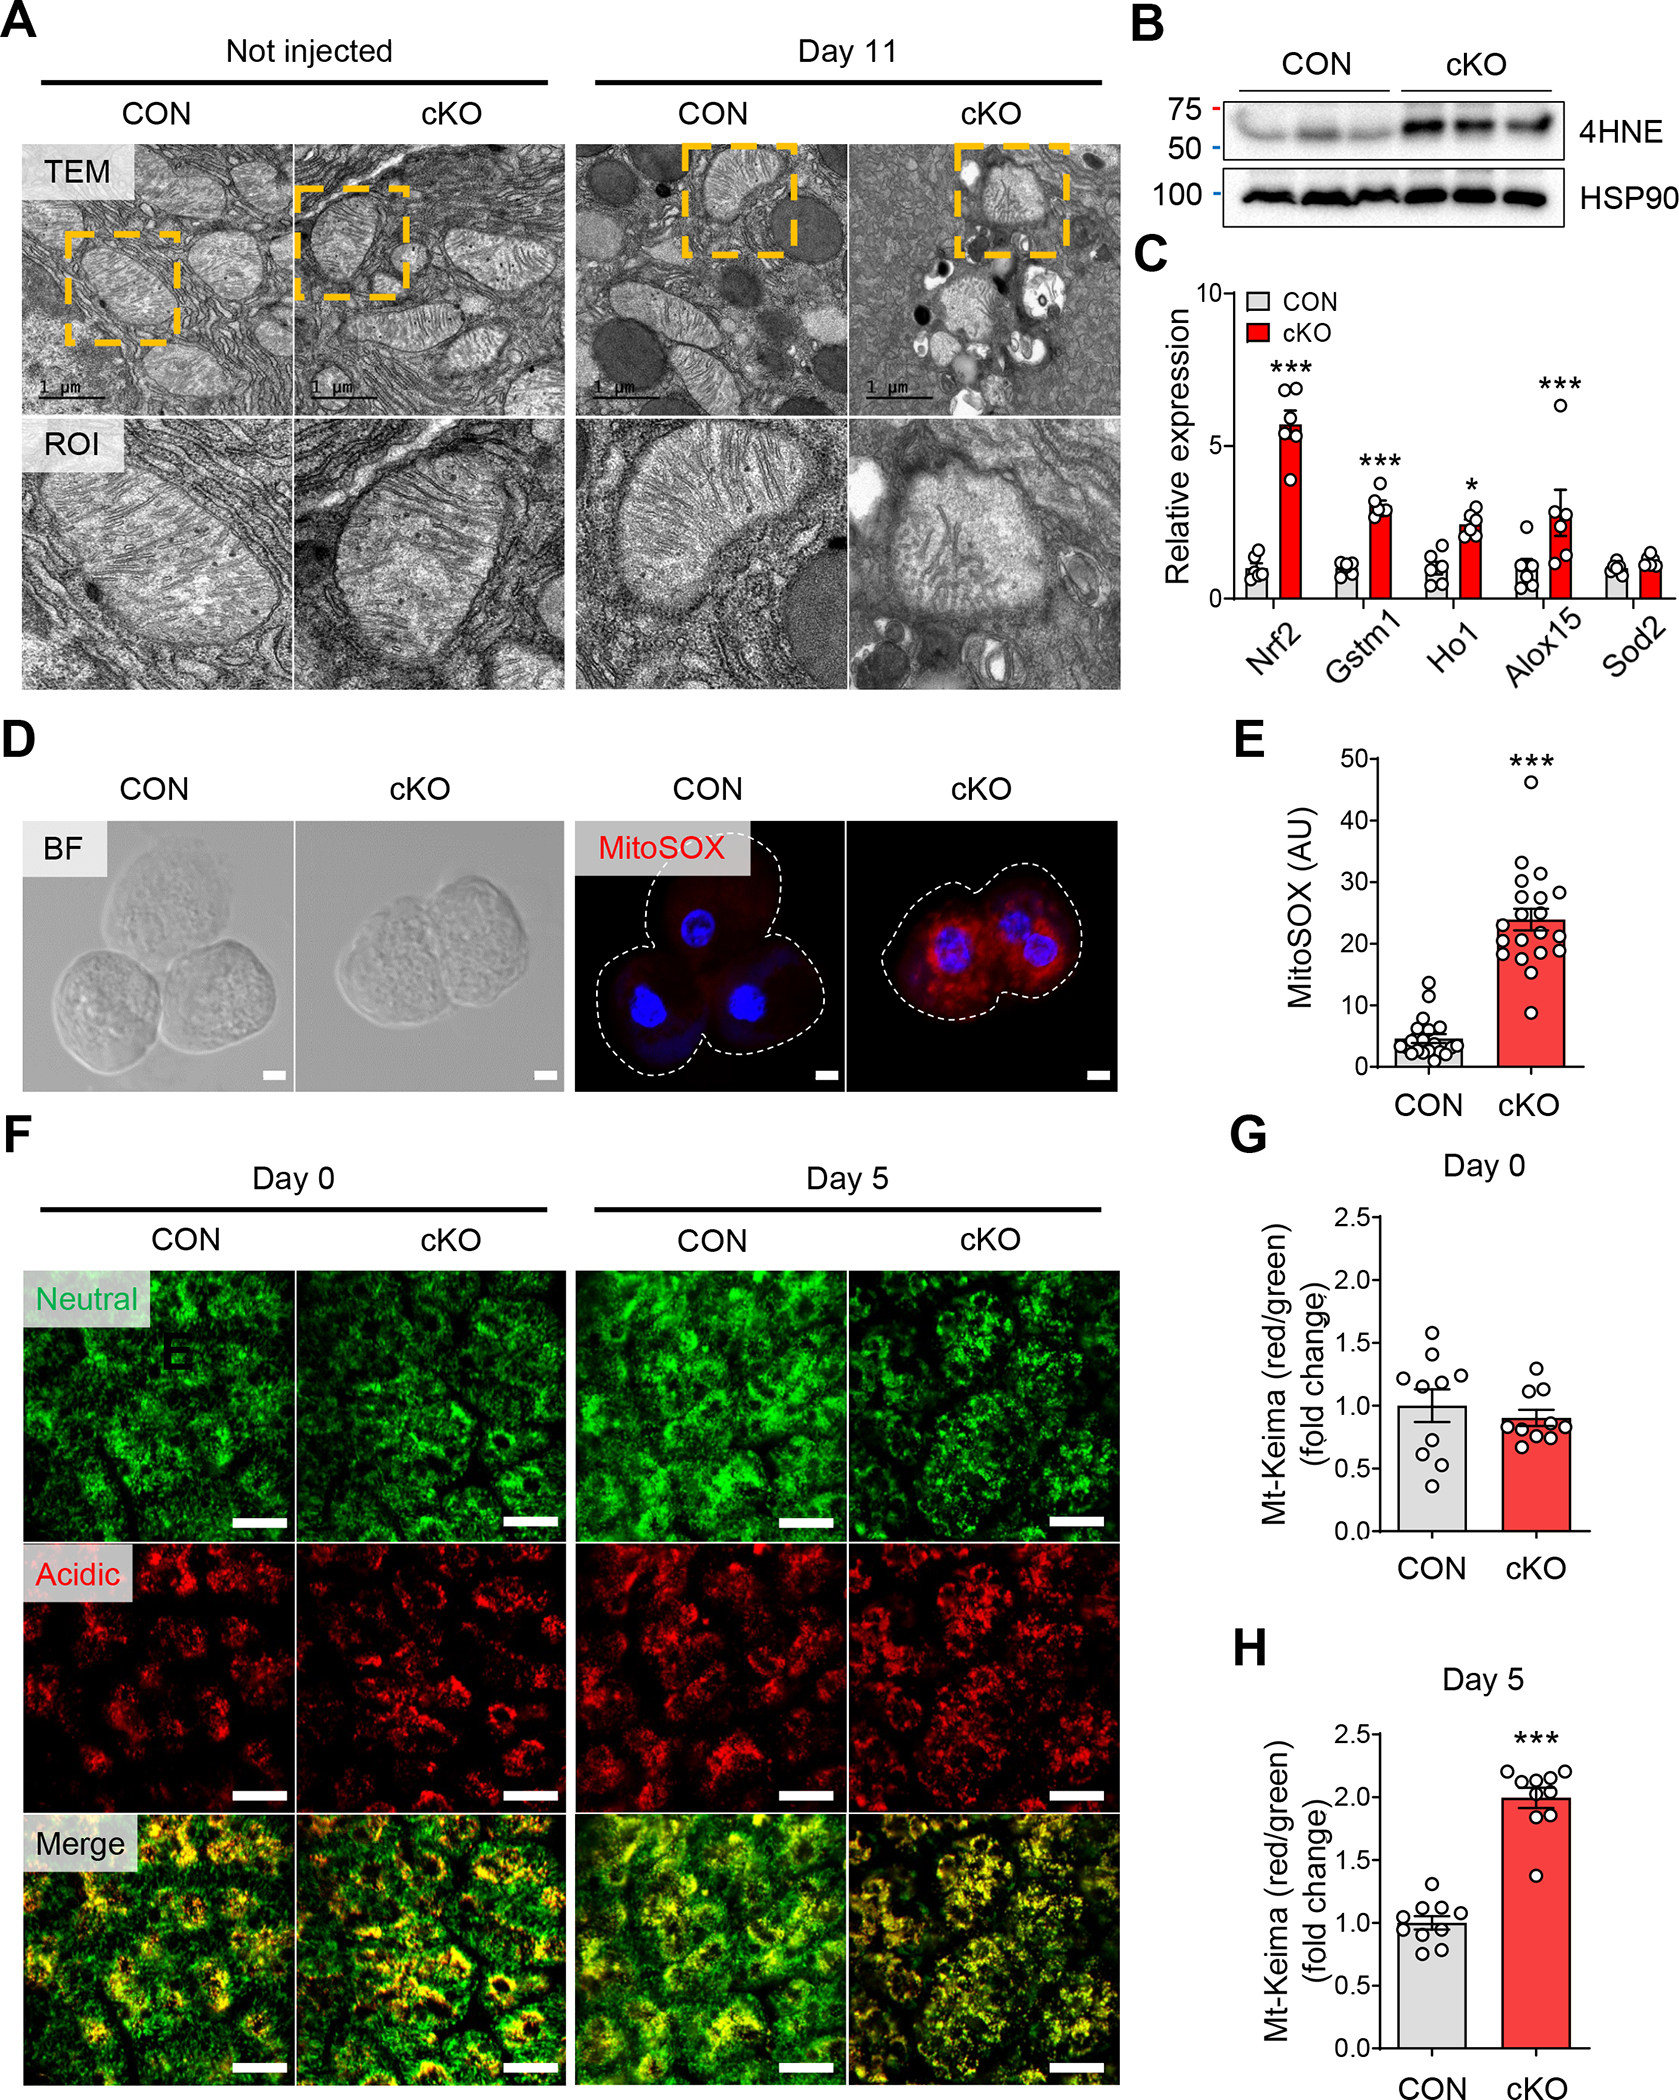
Figure 4. Mitochondrial dysfunction by ERRγ deletion induces ROS in pancreatic acinar cells.

(A) Transmission electronic microscopy images of pancreas tissue showing acinar cell mitochondria from control and ERRγ cKO 0 d (left panel) and 7 d (right panel) after the final TAM injection. Scale bar, 1 μm. (B) Western blot for 4-HNE and HSP90 in pancreas from control and ERRγ cKO mice 3 d after the final TAM injection. (C) Bright field (left panel) and fluorescence (right panel) images for MitoSOX (red) and DAPI (blue) in primary acini isolated from control and ERRγ cKO mice pancreas. MitoSOX fluorescence indicates production of mitochondrial superoxide. Scale bar, 5 μm. (D) Quantitation of MitoSOX fluorescence intensity (arbitrary units). (E) Relative gene expression of antioxidant markers in pancreas from control and ERRγ cKO mice. Results were normalized to 36b4. (F) In vivo time-course imaging of pancreas in control and ERRγ cKO; mt-Keima mice. mt-Keima protein is localized in the mitochondrial matrix and displays a bimodal excitation peak that is pH-dependent. The 488 nm excitation peak of mt-Keima (green) indicates mitochondria exposed to a neutral environment. The 561 nm excitation peak of mt-Keima (red) indicates mitochondria exposed to an acidic environment. Scale bar, 50 μm. (G-H) Quantitation of the mitophagy index as calculated by red/green area of mt-Keima signals at d 0 (G) and d 5. CON, control; cKO, ERRγ cKO. All data are presented as mean ± SEM. * p < 0.05, *** p < 0.005 by student’s t-test.
