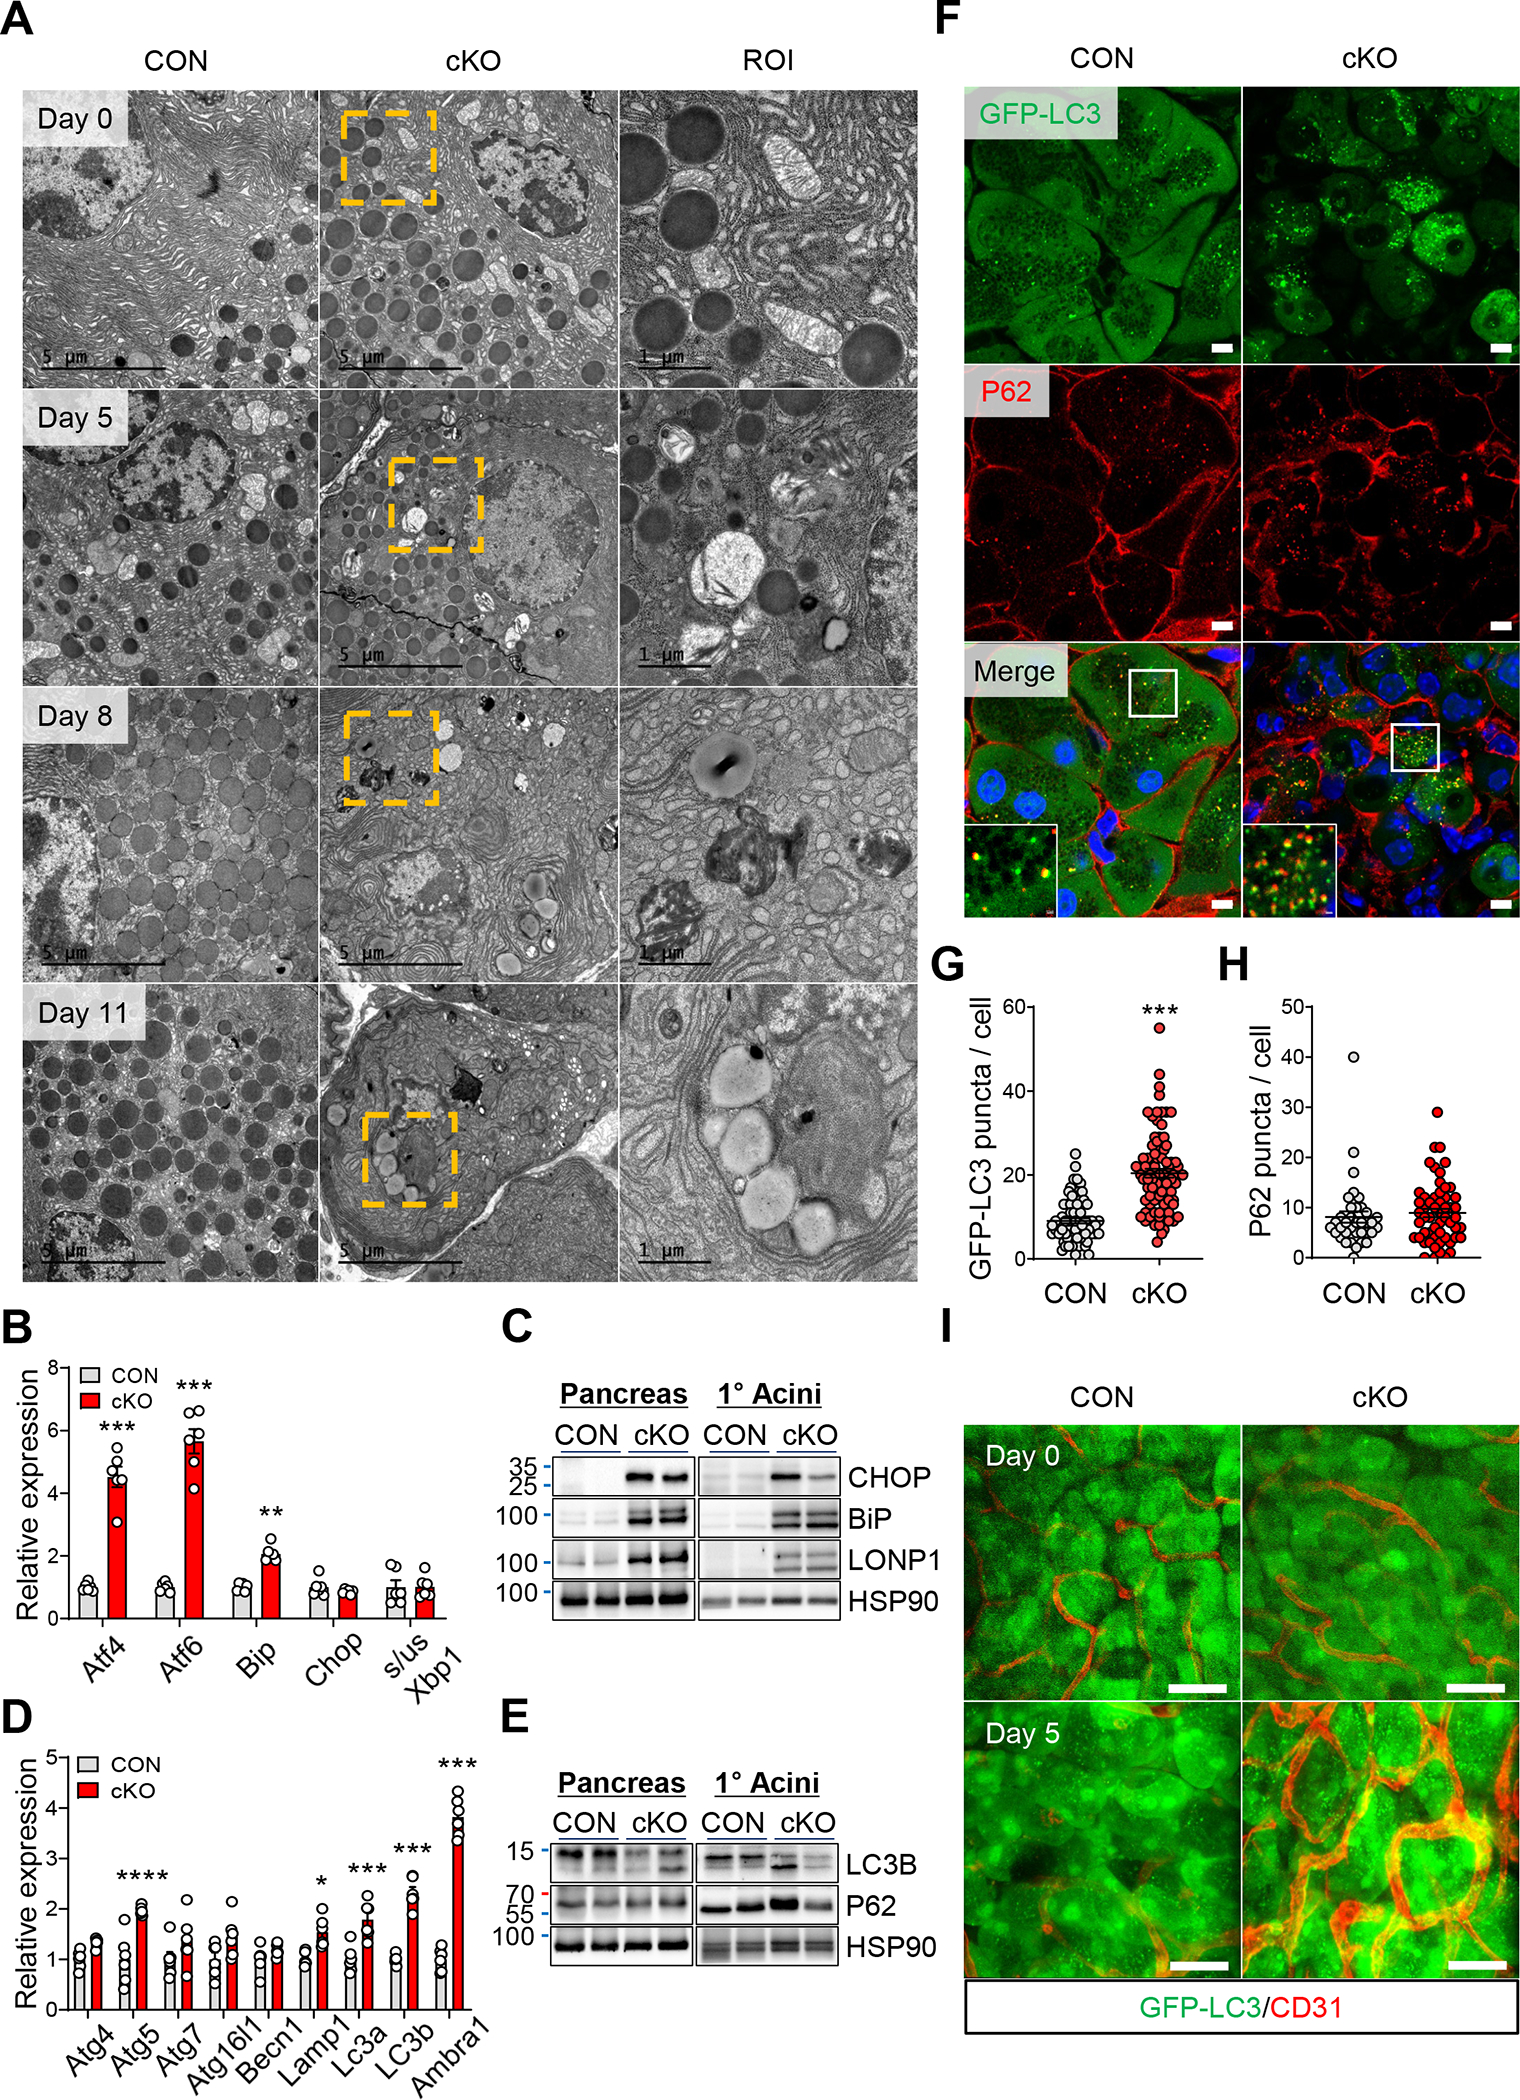
Figure 6. Loss of ERRγ results in ER stress and autophagy in pancreatic acinar cells.

(A) Transmission electronic microscopy images of pancreas tissue showing acinar cell from control and ERRγ cKO pancreas at indicated day after the final TAM injection. Scale bar, 5 μm and 1 μm for region of interest (ROI) (B) Western blot for ER stress markers in pancreas and primary acini from ERRγ cKO mice, compared to control 4 d after the final TAM injection. (C) Relative gene expression of ER stress markers in pancreas from control and ERRγ cKO mice. Results were normalized to 36b4. (D) Western blot for autophagy markers in pancreas and primary acinar cells of ERRγ cKO mice. (E) Relative gene expression of autophagy markers in pancreas from control and ERRγ cKO mice. Results were normalized to 36b4. (F) P62 immunofluorescence staining of frozen tissue sections from control and ERRγ cKO; GFP-LC3 transgenic mice pancreas. Scale bar, 5 μm (G-H) Quantitation of GFP-LC3 puncta per cell (G) and P62 puncta per cell (H). (I) Intravital imaging control and ERRγ cKO; GFP-LC3 transgenic pancreas. GFP-LC3 puncta (green) indicate autophagosomes and CD31 (red) indicates blood vessels. CON, control; cKO, ERRγ cKO. Scale bar, 50 μm. All data are presented as mean ± SEM. * p < 0.05, ** p<0.01, *** p < 0.005 by student’s t-test.
