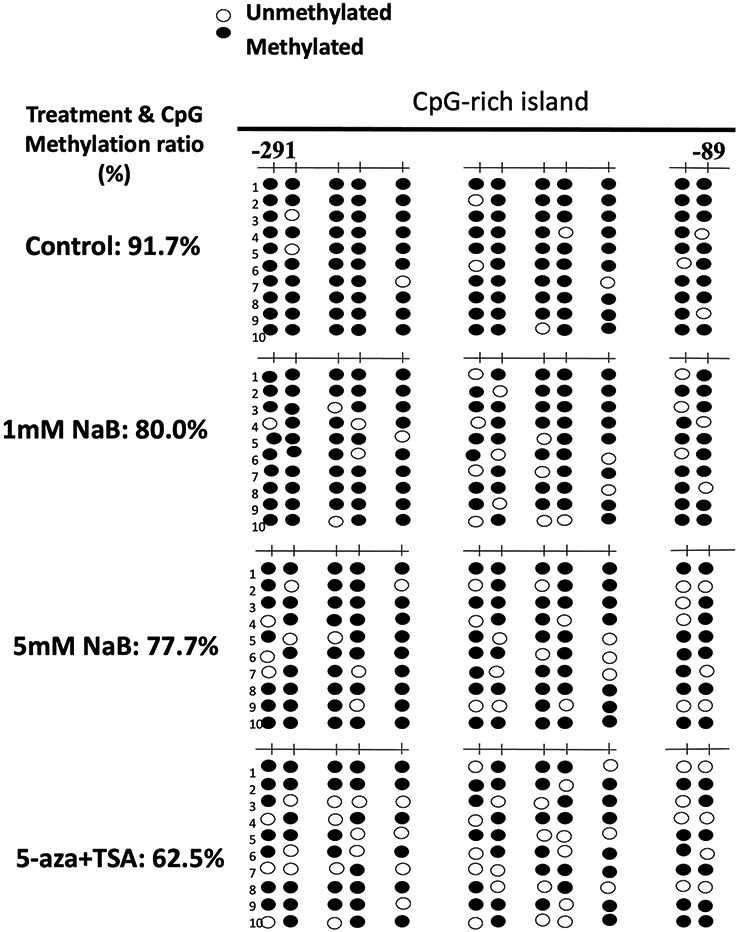
Figure 7. Effect of NaB on KEAP1 promoter methylation in HCT116 cells.

Cells were treated with 1.0 or 5 mM NaB for 5 days, and then genomic DNA was extracted from the treated cells. A combination treatment of 5-aza (500 nM)/TSA (100 nM) was used as positive control, while TSA was added 24 h before cell collection. The methylation pattern of the first 12 CpGs located at −291 and 337 in KEAP1 promoter region, where the translational starting site is considered as +1 was determined. Black dots indicated methylated CpGs while open circles indicate unmethylated CpGs. At least ten clones were picked randomly and sequenced from each of the three independent experiments.
