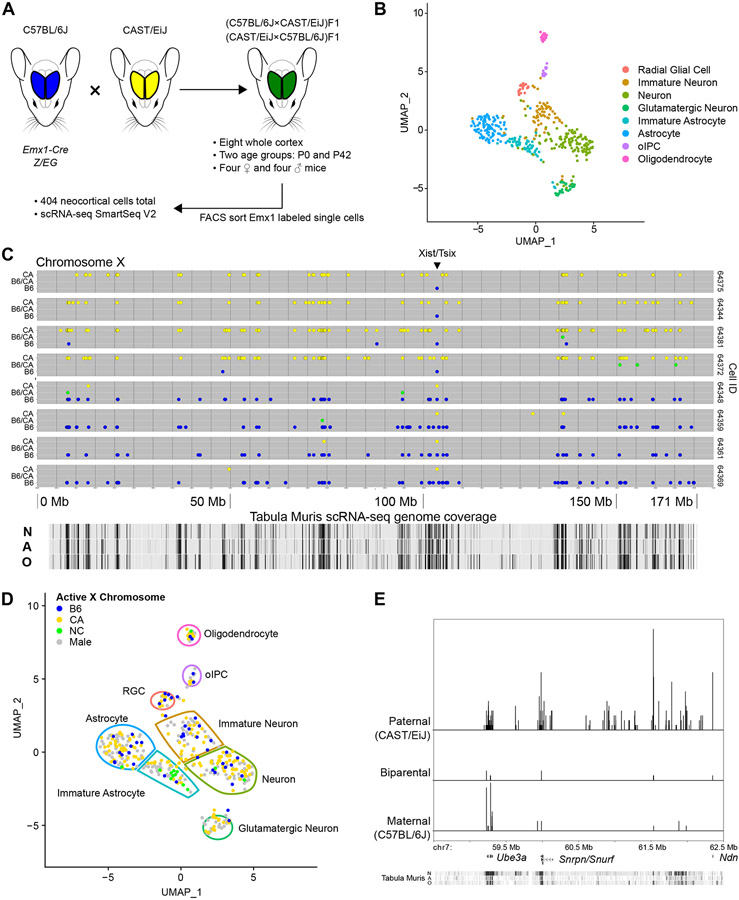
Figure 1. Isolation and transcriptome sequencing of mouse neocortical cells.
(A) B6 (blue) and CA (yellow) mice were crossed in both directions to create heterozygous F1 offspring (green). Single Emx1 expression-marked neocortical cells were isolated from two different ages and their transcriptomes sequenced.
(B) 404 cells, shown in dimensionally reduced (UMAP) space, were clustered based on gene expression and eight cell types identified. oIPC = oligodendrocytic intermediate progenitor cell.
(C) Representative allele plots of heterozygous X-chromosome SNVs in eight cells (rows) from a female P0 mouse, showing X-inactivation. Note the reciprocal allele state detected at the Xist/Tsix locus. Allele state: blue = B6, green = B6/CA, yellow = CA. N = neuron, A = astrocyte, O = oligodendrocyte.
(D) Active X-chromosome for female cells shown in dimensionally reduced space. NC = biparental/not called.
(E) Imprinting associated with the Prader-Willi/Angelman syndrome locus. Relative density histogram ridgeline plots (1 bp bins) of cells expressing maternal, paternal, or biparental variants at particular SNV locations from one mouse (P0-2, 64 cells). Chromosome coordinates, discussed genes, and Tabula Muris scRNA-seq coverage track (as in C) are shown on the x-axis. Relative density for each allele category is indicated on the y-axis.
UMAP visualizations and scRNA-seq based alleles are derived from Seurat_CountMatrix and VCFs Supplemental Data sets.

