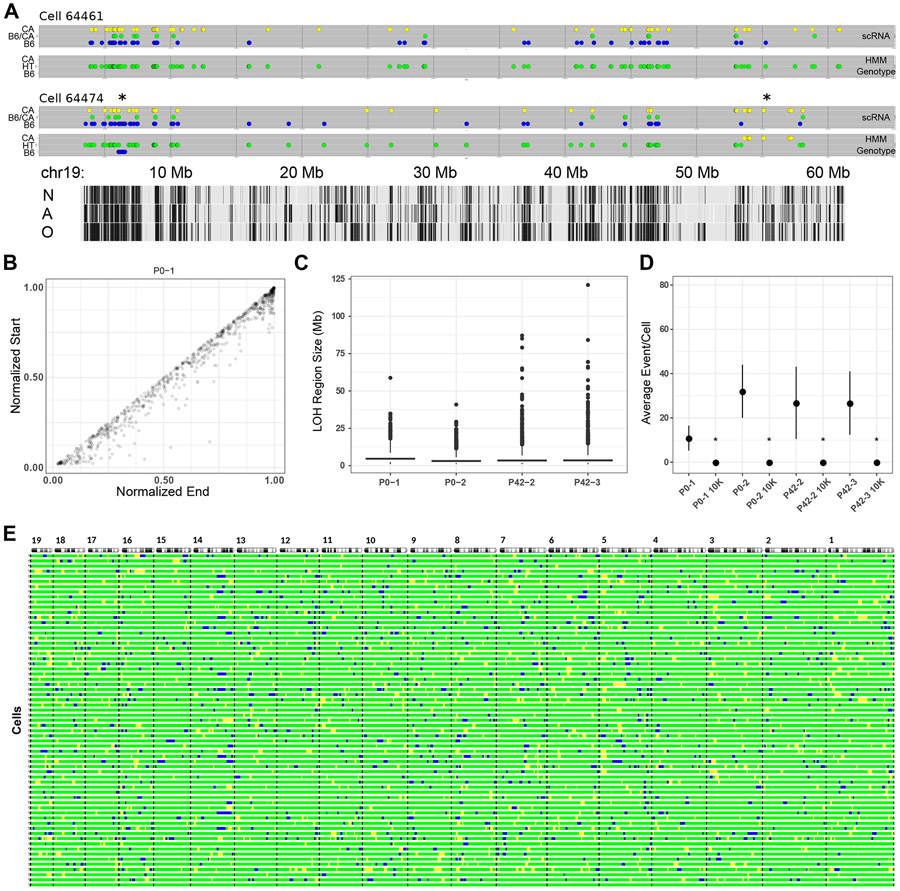
Figure 2. Inferring LOH from scRNA-seq.
(A) HMM results showing two mouse cells with either no LOH event (cell 64461) or two events (cell 64474, marked with *) along chromosome 19. Detected loci are shown as in Figure 1C, with the vertical axis indicating expressed allele state (scRNA) or HMM-inferred genotype (HMM Genotype). Tabula Muris cell-type specific transcription tracks are shown at the bottom, N = neuron, A = astrocyte, O = oligodendrocyte.
(B) Length-normalized chromosome positions of all LOH events from all autosomes of one mouse.
(C) Distribution of LOH lengths (≥1 Mb) for all mice showing median (bar) and IQR (box).
(D) Violin plots of average LOH events per cell for each mouse (n = 56 (P0-1), 64 (P0-2), 56 (P42-2), 47 (P42-3)) and 10,000 randomly sampled in silico cells from the respective mouse. Mean and standard deviation are indicated for each by a black circle and vertical lines. *p-value <10−5 (two sample Z-test, mouse vs. 10K sampled cells).
(E) Autosomal barcode of 56 cells plus a virtual zygote (bottom bar) derived from one mouse (P0-2). Autosomes are shown at the top with the centromeres on the left. Black bars indicate autosomal boundaries. For all panels, blue = B6, green = B6/CA, yellow = CA.
Supplemental Data: HMM_Genotype_Tables

