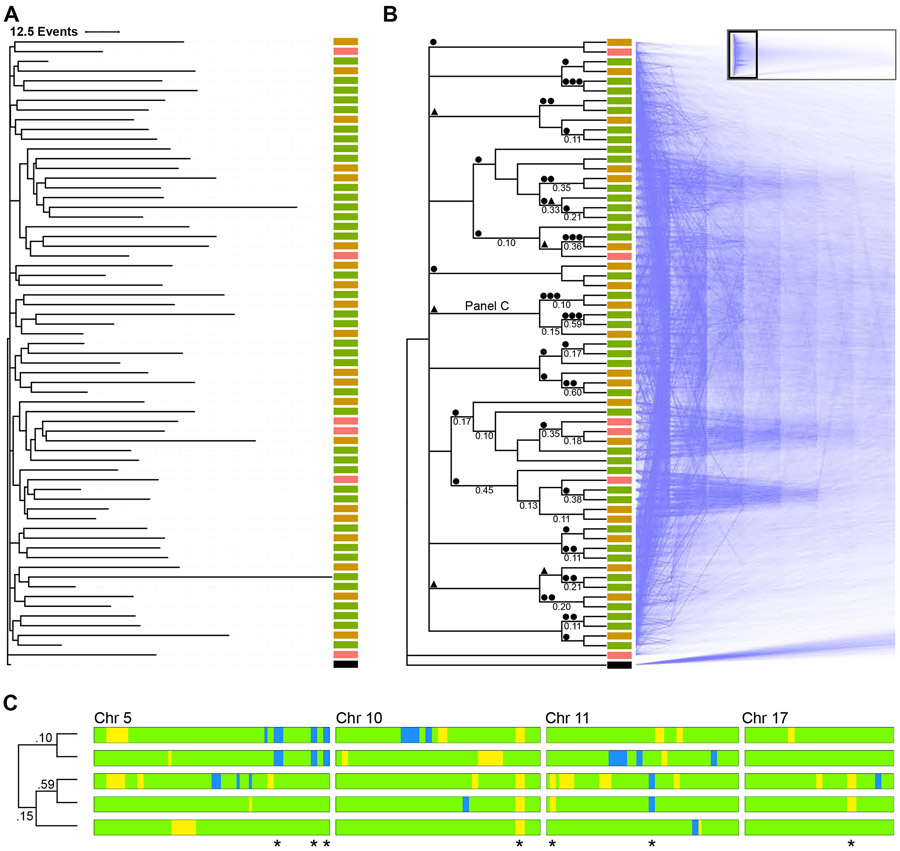
Figure 3. Phylogenetic analysis using LOH events.
(A) Lineage of 56 cortical cells plus a virtual zygote from a P0 mouse was inferred using a Camin-Sokal parsimony-inspired Bayes model. Consensus phylogram shows the relatedness and number of LOH events for each cell. Scale bar = 12.5 events. ■ RGC, ■ immature neuron, ■ neuron, ■ zygote.
(B) The same lineage in cladogram form with supporting nodal posterior probabilities ≥0.1 indicated, with mirrored “densiTree” representation of 1,500 sampled cladograms. The complete densiTree representation is shown as an inset with magnified area indicated. ● LOH event shared among all daughter cells, ▲ LOH event shared in all but one daughter cell.
(C) Barcode of segregating alleles (*) from a monophyletic clade marked “Panel C” in panel above. Chromosomes are aligned with the centromere to the left. Blue and yellow regions indicate LOH events (B6 and CA, respectively). Green regions indicate heterozygosity. Node posterior probability shown on the cladogram.

