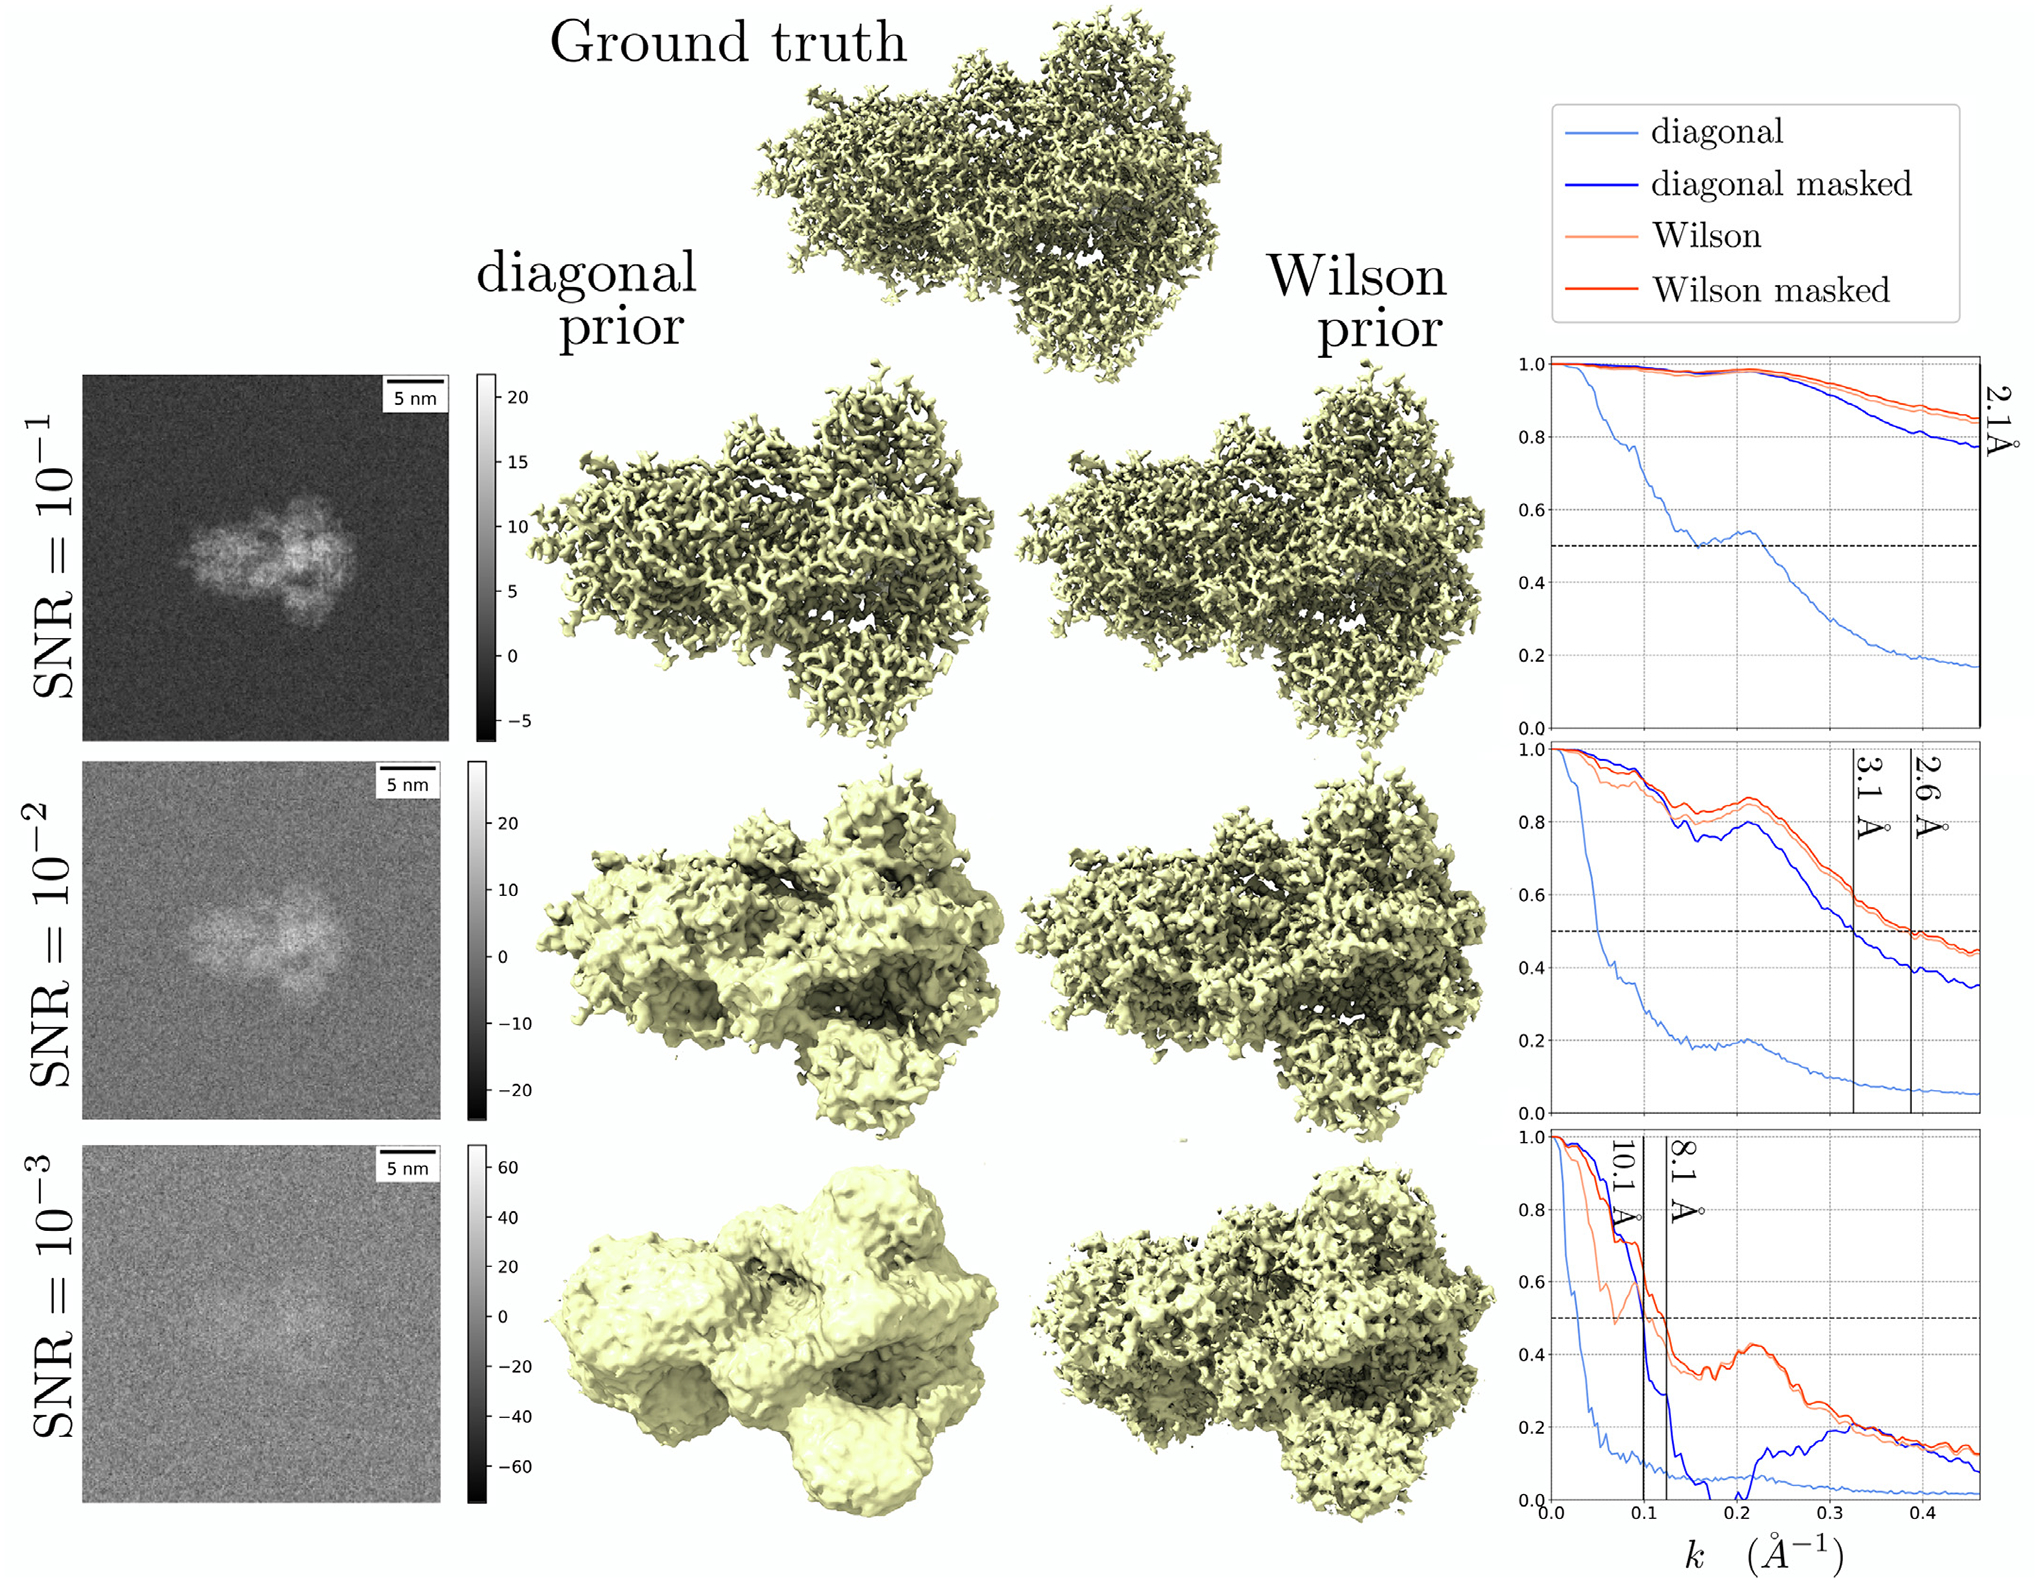
Fig. 2.

Denoising of the spike protein contaminated with Gaussian white noise at different SNRs. Left: projected images of the noisy observations. Middle: isosurface visualization of the ground truth, the MAP-diagonal estimate, and the MAP-Wilson estimate. Isosurface levels were qualitatively set to reflect the structure best. Right: FSC plots.
