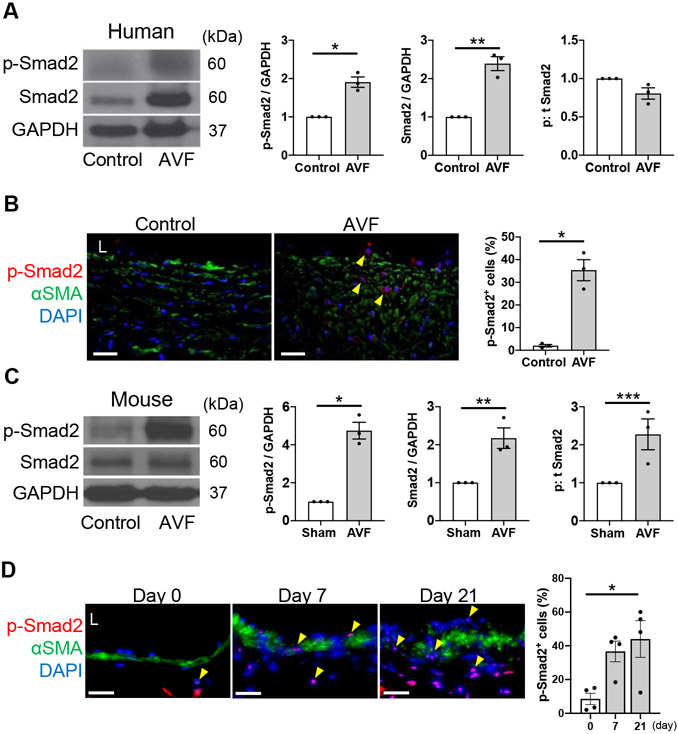
Figure 1. Increased p-Smad2 in mature human and mouse arteriovenous fistula (AVF).
(A) Representative Western blot (WB) of p-Smad2 and Smad2 in human control vein and AVF with densitometry; p-Smad2: *P=0.0026 (t test), P=0.1000 (U test), Smad2: **P=0.0015 (t test), P=0.1000 (U test), p:t Smad2: P=0.0574 (t test), P=0.1000 (U test); n=3 per group. (B) Representative photomicrographs showing immunofluorescence (IF) of p-Smad2 (red), αSMA (green) and DAPI (blue) in human control vein and AVF wall, quantified as percentage of p-Smad2 positive cells in the AVF wall, * P=0.0020 (t test), P=0.1000 (U test); n=3 per group. (C) Representative WB of p-Smad2 and Smad2 in the AVF of mice harvested at day 21 after sham operation or AVF creation with densitometry. p-Smad2: *P=0.0011 (t test), P=0.1000 (U test), Smad2: **P=0.0122 (t test), P=0.1000 (U test), ***p:t Smad2: P=0.0348 (t test), P=0.1000 (U test); n=3 per group. (D) Representative photomicrographs showing IF of p-Smad2 (red), αSMA (green) and DAPI (blue) in the AVF wall at days 0 to 21 quantified as percentage of p-Smad2 positive cells in the AVF wall; P=0.0194 (ANOVA), P=0.0403 (Kruskal-Wallis), * P=0.0205 (day 0 vs 21, Tukey’s post hoc); n=4 per group. Four high power field images were used to acquire the mean value per animal (B, D). All data are represented as mean value±SEM. L, lumen. Scale bars, 20 μm.

