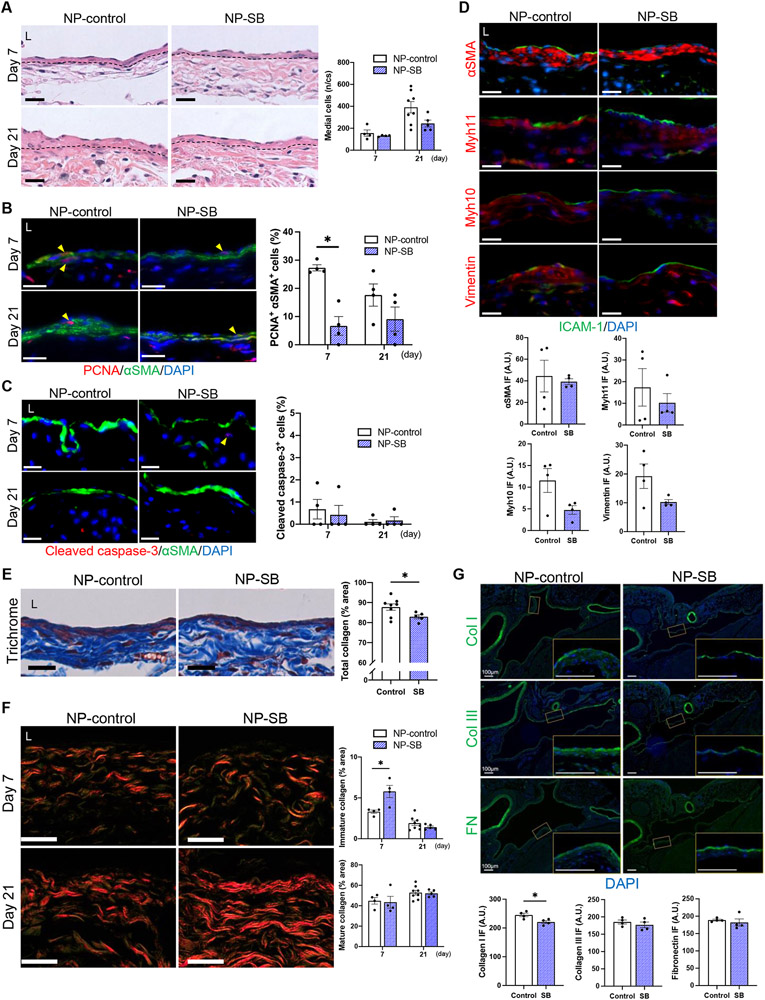
Figure 3. SB431542-containing nanoparticles (NP-SB) regulate SMC proliferation and ECM composition.
C57BL/6J mice were administered with NP-SB or unloaded nanoparticles (NP-control) in pluronic gel once, immediately after arteriovenous fistula (AVF) creation (day0). (A) Representative photomicrographs of hematoxylin and eosin staining of the AVF wall at days 7 and 21, and the total number of medial cells in the AVF wall per cross section (n/cs). Dashed lines denote the elastic lamina; P=0.0797 (ANOVA); n=4 (day 7) and 8 (day 21) for NP-control, n=4 (day 7) and 5 (day 21) for NP-SB. (B) Representative photomicrographs showing immunofluorescence (IF) of PCNA (red) merged with αSMA (green) and DAPI (blue) in AVF wall at days 7 and 21, quantified as percentage of PCNA-αSMA dual-positive cells in the AVF wall; P=0.0010 (ANOVA); *P=0.0062 (day 7, Sidak’s post hoc); n=4 each. (C) Representative photomicrographs showing IF of cleaved caspase-3 (red) merged with αSMA (green) and DAPI (blue) in AVF wall at days 7 and 21, quantified as percentage of cleaved caspase-3-positive cells in the AVF wall; P=0.7744 (ANOVA); n=4 each. (D) Representative photomicrographs showing IF of αSMA (red), Myh11 (red), Myh10 (red) or vimentin (red) merged with ICAM-1 (green) and DAPI (blue) in AVF wall (day 21), quantified as IF intensity in the medial layer; αSMA: P=0.7480 (t test with Welch’s correction), P>0.9999 (U test); Myh11: P>0.9999 (U test); Myh10: P=0.0593 (t test), P=0.2000 (U test); vimentin: P=0.1238 (t test with Welch’s correction), P=0.3429 (U test); n=4 each. (E) Representative photomicrographs of Masson’s trichrome staining of the AVF wall (day 21), quantified as percentage of collagen area within the AVF wall, *P=0.0496 (t test), P=0.0653 (U test); n=8 for NP-control, n=5 for NP-SB. (F) Representative photomicrographs of picrosirius red staining of the AVF wall (days 7 and 21) examined under polarized light. Mature collagens appear as strongly birefringent red-orange fibers and immature collagens as weakly birefringent green fibers. Bar graphs show percentage of immature or mature collagen area within the AVF wall; immature collagen: P=0.0188 (ANOVA), *P=0.0040 (day 7, Sidak post hoc); mature collagen: P=0.7491 (ANOVA); n=4 (day 7) and 8 (day 21) for NP-control, n=4 (day 7) and 5 (day 21) for NP-SB. (G) Representative photomicrographs showing IF of collagen type I (top, green), collagen type III (middle, green) or fibronectin (bottom, green) merged with DAPI (blue) in the AVF wall (day 7), quantified as IF intensity in the AVF wall; collagen type I : *P=0.0205 (t test), P=0.0571 (U test) ; collagen type III: P=0.4323 (t test), P=0.4857 (U test) ; fibronectin: P=0.5595 (t test with Welch’s correction), P=0.3429 (U test) ; n=4 each. High-magnification images of the AVF wall shown in boxed areas are shown to the lower-right. Four (B-F) or 8 (G) high power field images were used to acquire the mean value per animal. All data are represented as mean value±SEM. L, lumen; A.U., arbitrary unit. Scale bars, 20 μm.

