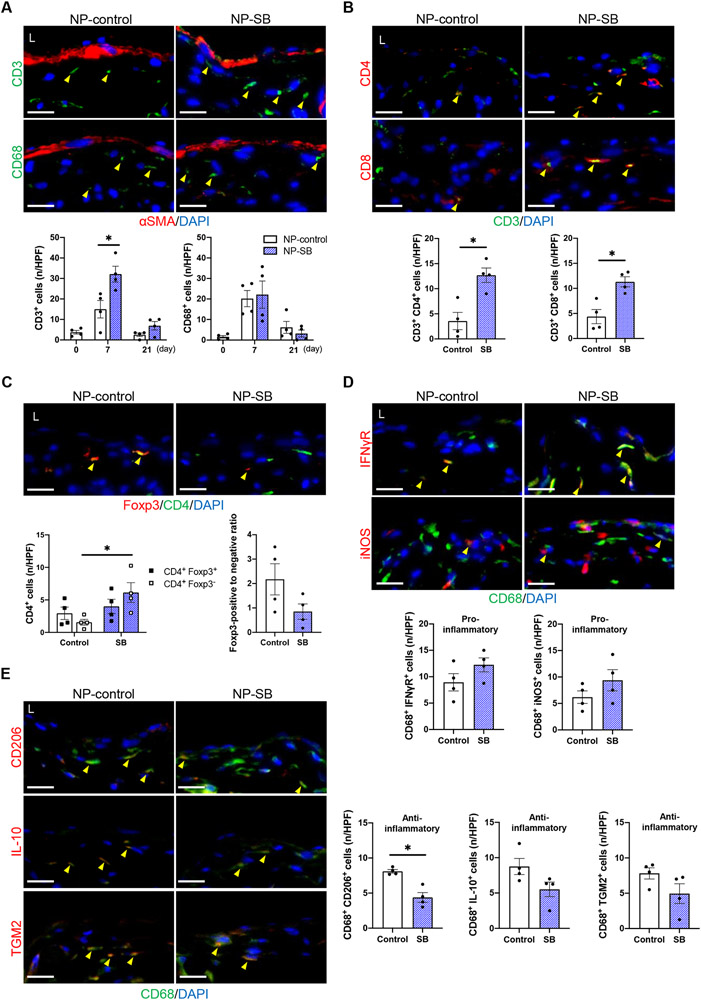
Figure 4. SB431542-containing nanoparticles (NP-SB) regulate inflammatory cells.
C57BL/6J mice were administered with NP-SB or unloaded nanoparticles (NP-control) in pluronic gel once, immediately after arteriovenous fistula (AVF) creation (day0). (A) Representative photomicrographs showing immunofluorescence (IF) of CD3 (green) or CD68 (green) merged with αSMA (red) and DAPI (blue) in the AVF wall (day 7), quantified as the number of CD3 or CD68 positive cells in the AVF wall (days 0–21); CD3: P=0.0029 (ANOVA), *P=0.0025 (day 7, Sidak’s post hoc); CD68: P=0.9018 (ANOVA); n=4 each. (B) Representative photomicrographs showing IF of CD4 (red) or CD8 (red) merged with CD3 (green) and DAPI (blue) in the AVF wall (day 7), quantified as the number of dual-positive cells in the AVF wall; CD3+ CD4+: *P=0.0066 (t test), P=0.0286 (U test); CD3+ CD8+: *P=0.0072 (t test), P=0.0286 (U test); n=4 each. (C) Representative photomicrographs showing IF of Foxp3 (red) merged with CD4 (green) and DAPI (blue) in fistula wall (day 7), quantified as the number of Foxp3-positive (black square dot) or Foxp3-negative (white square dot), CD4-positive cells as well as the ratio of Foxp3-positive to Foxp3-negative CD4-positive cells in the AVF wall; CD4+ Foxp3+: P=0.4949 (t test), P=0.4857 (U test); CD4+ Foxp3−: * P=0.0280 (t test), P=0.0286 (U test); Foxp3-positive to negative ratio: P=0.1122 (t test), P=0.2000 (U test); n=4 each. (D, E) Representative photomicrographs showing IF of (D) IFNγR (red), iNOS (red), (E) CD206 (red), IL-10 (red) or TGM2 (red) merged with CD68 (green) and DAPI (blue) in the AVF wall (day 7), quantified as the number of dual-positive cells in the AVF wall; CD68+ IFNγR+: P=0.1662 (t test), P=0.2000 (U test); CD68+ iNOS+: P=0.2206 (t test), P=0.3429 (U test); CD68+ CD206+: *P=0.0024 (t test), P=0.0286 (U test); CD68+ IL-10+: P=0.0795 (t test), P=0.0571 (U test); CD68+ TGM2+: P=0.1256 (t test), P=0.1143 (U test); n=4 each. Four high power field images were used to acquire the mean value per animal. All data are represented as mean value±SEM. L, lumen; n/HPF, number per high power field. Scale bars, 20 μm.

