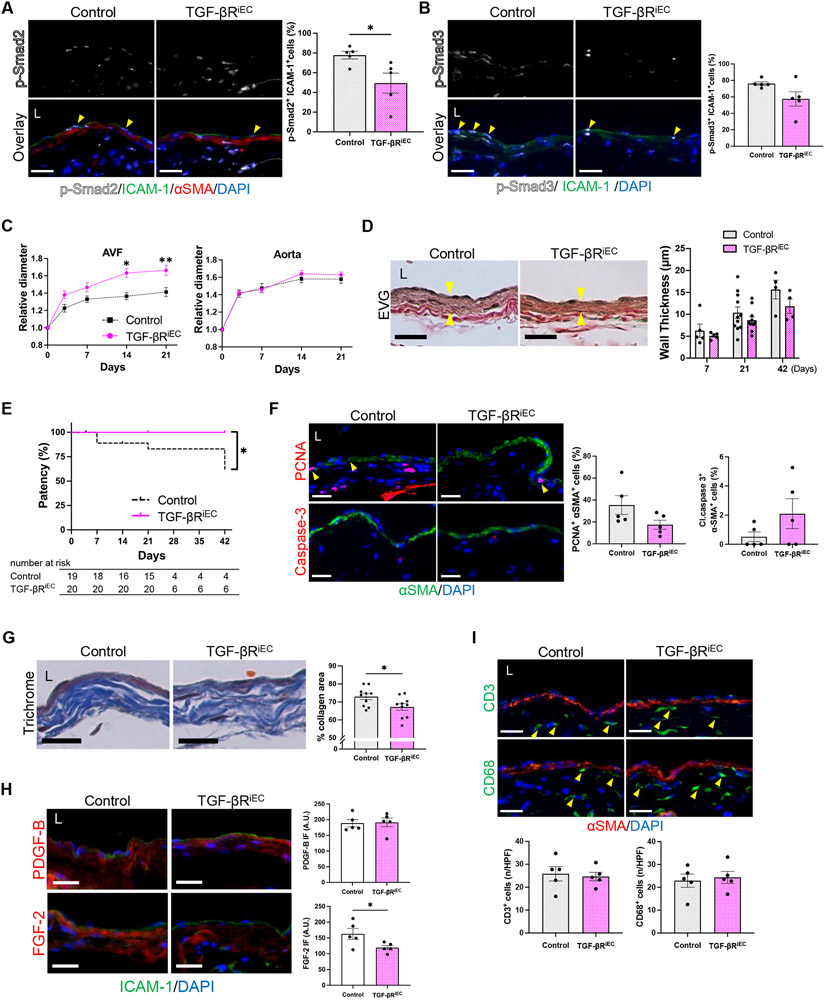
Figure 6. Inhibition of TGF-β signaling in endothelial cells impact arteriovenous fistula (AVF) maturation in mice.
Cdh5-CreERT2; Tgfbr1fl/fl; Tgfbr2fl/fl; mT/mG mice were treated with vehicle (Control) or tamoxifen (TGF-βRiEC) and underwent AVF creation (day0). (A) Representative photomicrographs showing immunofluorescence (IF) of p-Smad2 (white) merged with ICAM-1 (green), αSMA (red) and DAPI (blue) in the AVF wall at day 7 (yellow arrowheads denote p-Smad2-ICAM1 dual positive cells), quantified as percentage of p-Smad2-ICAM1 dual positive cells in the AVF wall; *P=0.0312 (t test), P=0.0317 (U test); n=5 each. (B) Representative photomicrographs showing IF of p-Smad3 (white) merged with ICAM-1 (green) and DAPI (blue) in the AVF wall at day 7 (yellow arrowheads denote p-Smad3-ICAM1 dual positive cells), quantified as percentage of p-Smad3-ICAM1 dual positive cells in the AVF wall; P=0.1002 (t test with Welch’s correction), P=0.1349 (U test); n=5 each. (C) Outward remodeling of the AVF and aorta up to day 21. Values are normalized by preoperative measurement; AVF: P=0.0010 (ANOVA), *P=0.0014 (day14, Sidak’s post hoc), **P=0.0170 (day21, Sidak’s post hoc); aorta: P=0.4837 (ANOVA); n=18 for control, n=17 for TGF-βRiEC. (D) Representative photomicrographs of Van Gieson’s staining showing wall thickness (yellow arrowheads) of the AVF at day 21, and quantification of AVF wall thickness at days 7-42; P= 0.0665 (ANOVA); n=5 (day 7), 11 (day 21) and 4 (day 42) for control, n=5 (day 7), 11 (day 21) and 4 (day 42) for TGF-βRiEC. (E) Line graph showing AVF patency up to day 42, *P=0.0239 (Log-rank); n=19 for control, n=20 for TGF-βRiEC at day 0. (F) Representative photomicrographs showing IF of PCNA (red, top) or cleaved caspase-3 (red, bottom) merged with αSMA (green) and DAPI (blue) in the AVF at day 7, quantified as percentage of PCNA-αSMA and cleaved caspase-3-αSMA dual-positive cells; PCNA: P=0.0957 (t test), P=0.2222 (U test), cleaved caspase-3: P=0.2857 (U test); n=5 each. (G) Representative photomicrographs of Masson’s trichrome staining of the AVF wall at day 21, quantified as percentage of collagen area within the AVF wall, *P=0.0323 (t test); n=10 each. (H) Representative photomicrographs showing IF of PDGF-B (red, top) or FGF-2 (red, bottom) merged with ICAM-1 (green) and DAPI (blue) in the AVF at day 7, quantified as IF intensity in the AVF wall; PDGF-B: P=0.9010 (t test), P=0.8413 (U test); FGF-2: *P= 0.0445 (t test), P=0.0952 (U test); n=5 each. (I) Representative photomicrographs showing IF of CD3 (green) or CD68 (green) merged with αSMA (red) and DAPI (blue) in the AVF wall (day 7), quantified as the number of CD3 or CD68 positive cells in the AVF wall (day 7); CD3: P=0.7484 (t test), P=0.7937 (U test); CD68: P=0.7200 (t test), P>0.9999 (U test); n=5 each. Four (A, B, F, G, I) or 8 (D, H) high power field images were used to acquire the mean value per animal. All data are represented as mean value±SEM. L, lumen; A.U., arbitrary unit; n/HPF, number per high power field. Scale bars, 20 μm.

