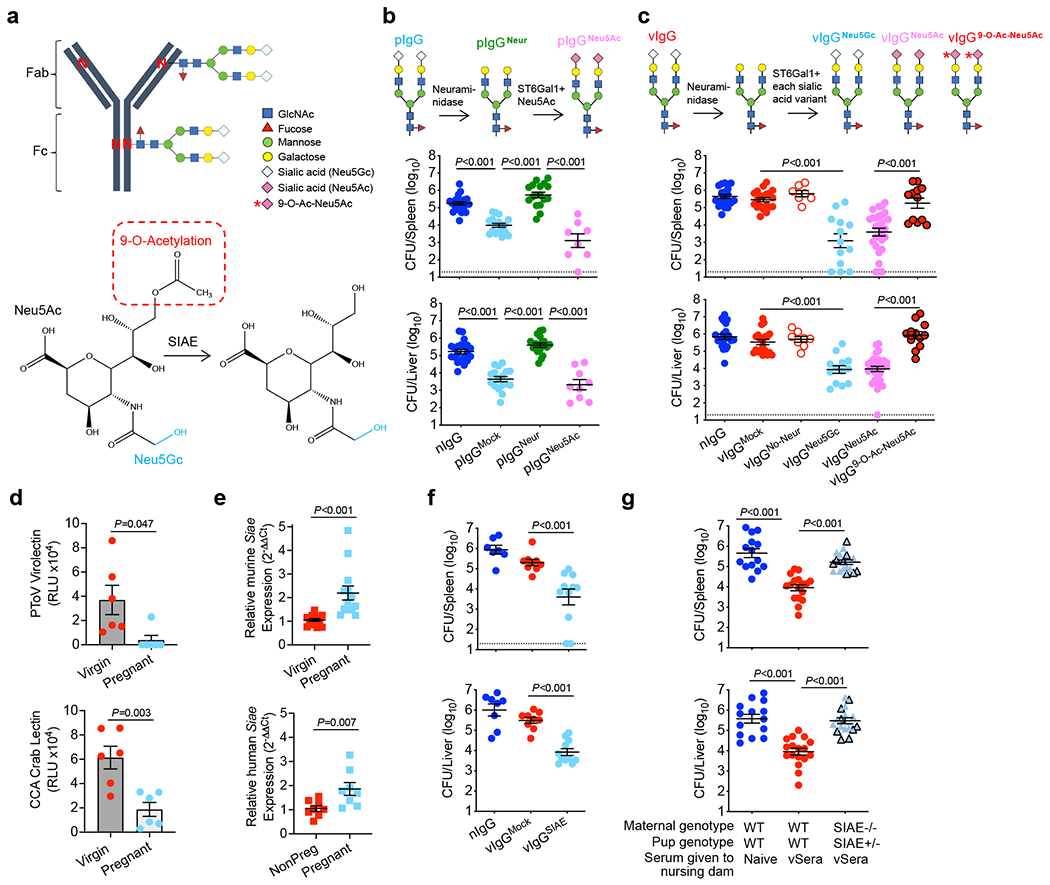
Fig. 2. SIAE deacetylates anti-Lm IgG sialic acid enabling antibody-mediated protection.

(a) IgG N-linked glycosylation schematic including sialic acid variants and SIAE activity. (b) IgG from naive (nIgG) or preconceptual ΔActA Lm-primed pregnant/postpartum (pIgG) mice was glycoengineered to remove existing sialic acid with neuraminidase (pIgGNeur) followed by resialylation with ST6Gal1 plus CMP-Neu5Ac (pIgGNeu5Ac). Bacterial burdens after virulent Lm infection in neonatal mice following transfer of indicated pIgG preparations. (c) IgG recovered from naive (nIgG) or ΔActA Lm-primed virgin (vIgG) mice, treated with neuraminidase, then resialylated with each sialic acid variant using ST6Gal1 plus CMP-sialic acid donors. Bacterial burdens after Lm infection in neonatal mice following transfer of indicated vIgG preparations. (d) PToV virolectin and CCA lectin detection of 9-O-Acetyl-Neu5Gc in virgin compared with pregnant LLO-specific IgG. (e) Relative Siae expression in splenocytes from virgin and late gestation (E18-20) pregnant mice, or in PBMCs from non-pregnant (NonPreg) versus pregnant women (12-32 weeks gestation). (f) Bacterial burden after Lm infection in neonatal mice administered SIAE- or mock-treated vIgG. (g) Bacterial burden after Lm infection in neonatal mice nursed by WT or SIAE−/− (black outline, exon3−/−; no outline, exon3/4−/−) mice administered vSera on the day of delivery and 3 days later. Pups were infected with virulent Lm 3-4 days after birth, and where indicated, 24 hours after antibody transfer, with enumeration of bacterial burden 72 hours post-infection. Each symbol represents an individual mouse, with graphs showing data combined from at least 2 independent experiments each with 3-5 mice per group per experiment (b, c, e-g), or representative data from >3 independent experiments (d). Bar, mean ± standard error. P values between key groups were determined by one-way ANOVA adjusting for multiple comparisons (b, c, f, g) or unpaired t-test (d, e). Dotted lines, limit of detection.
