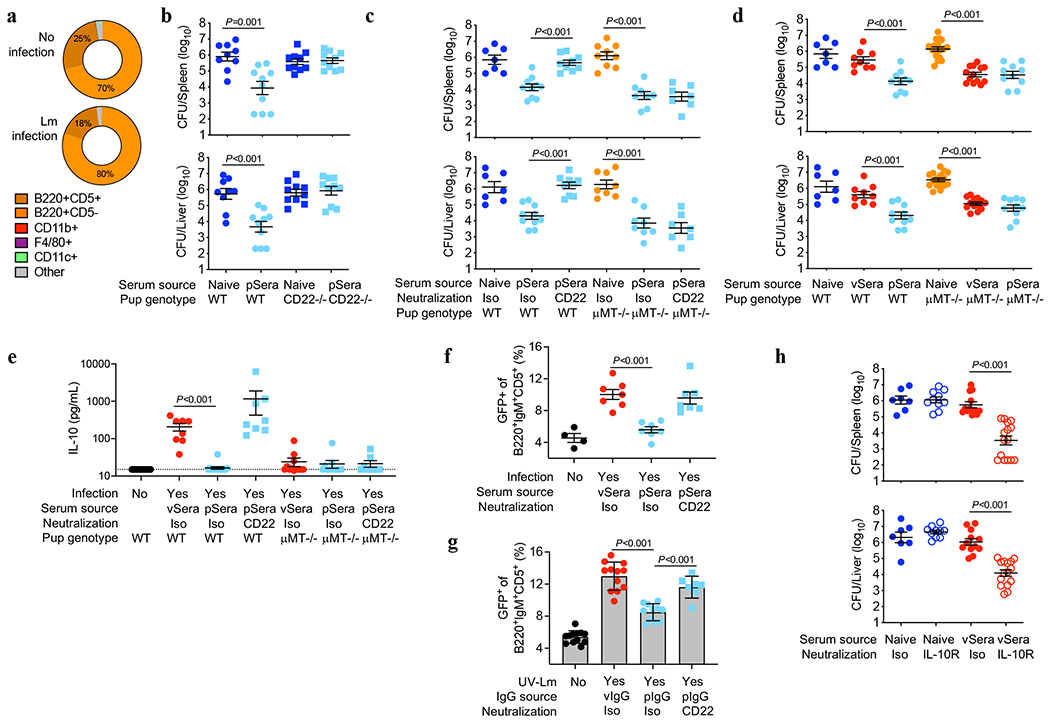
Fig. 4. Deacetylated anti-Lm antibodies protect via CD22-mediated suppression of B cell IL-10 production.

(a) CD22+ cell distribution amongst neonatal splenocytes 72 hours after Lm infection compared with uninfected controls. (b) Bacterial burden after Lm infection of WT or CD22-deficient neonatal mice transferred sera from ΔActA Lm-primed pregnant/postpartum (pSera) or naive mice. (c) Bacterial burden after Lm infection of WT or μMT−/− neonates administered pSera or naive sera, along with anti-CD22 or isotype control antibodies. (d) Bacterial burden after Lm infection of WT or μMT−/− neonates administered sera from ΔActA Lm-primed virgin mice (vSera), pSera, or naive sera. (e) Serum IL-10 levels 72 hours after Lm infection in WT or μMT−/− neonates administered vSera or pSera, plus CD22 neutralization . (f) B220+IgM+CD5+ splenocyte GFP expression 72 hours after Lm infection in neonatal IL10-eGFP reporter mice administered vSera or pSera, plus CD22 neutralization, compared with uninfected mice. (g) GFP expression by B220+IgM+CD5+ splenocytes from IL10-eGFP neonates stimulated with UV-inactivated Lm in the presence of vIgG or pIgG, plus CD22 neutralization. (h) Bacterial burden after Lm infection in neonates administered vSera or naive sera, along with anti-IL10 receptor or isotype control antibodies. Neonatal mice were infected with virulent Lm 3-4 days after birth, 24 hours after antibody transfer, with enumeration of bacterial burden 72 hours post-infection. Pie charts show representative data from one of 3 independent experiments, averaged across 5 mice per group (a). Each symbol represents the data from an individual mouse (b-f, h) with graphs showing data combined from at least 3 independent experiments with 3-5 mice per group per experiment, or cells in an individual well under unique stimulation conditions combined from 4-5 independent experiments (g). Bar, mean ± standard error. P values between groups determined by one-way ANOVA adjusting for multiple comparisons. Dotted line indicates limit of detection.
