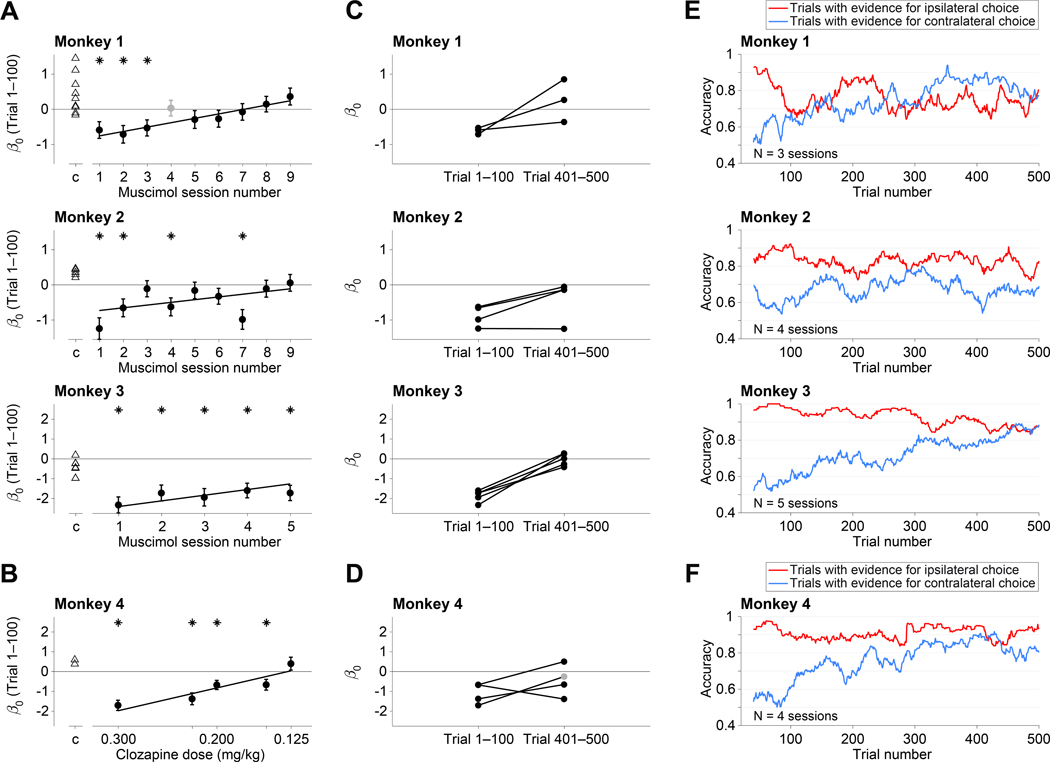
Figure 4: Compensation of bias across and within sessions.
A, The size of the contraversive bias (β0, Equation 2) in the first 100 trials following inactivation is plotted as a function of experimental session. Data are shown separately for the three monkeys that received muscimol. Negative bias (β0 < 0) indicates bias against contraversive decisions. Triangles are data from control sessions. Asterisks denote statistical significance . The regression line is from the fit to Equation 6, excluding session 4 for Monkey 1 (gray point), in which we injected a smaller volume (8 μL; see Methods). Error bars are s.e. B, Effect of clozapine dose on decision bias (Monkey 4). Same conventions as in A. C–F, Within session compensation. These analyses use only sessions with a statistically significant bias in the first 100 trials (asterisks in A & B). See also Figure S3. C, Individual muscimol sessions. Each line connects the bias in trials 1–100 with the bias in trials 401–500. D, Individual clozapine sessions (Monkey 4). Same conventions as in C, except for one session, in which only 286 trials were completed. The gray point is the bias from the last 100 trials (trials 186–286). E, F Gradual diminution of the bias. These analyses combine the individual experiments in C & D and group trials with the same sign of evidence (color), regardless of evidence strength (trials with 0% coh or Δt = 0 are excluded). The traces are running means of choice accuracy over 40 trials. Trial numbers on the abscissa correspond to the end of the averaging window.

