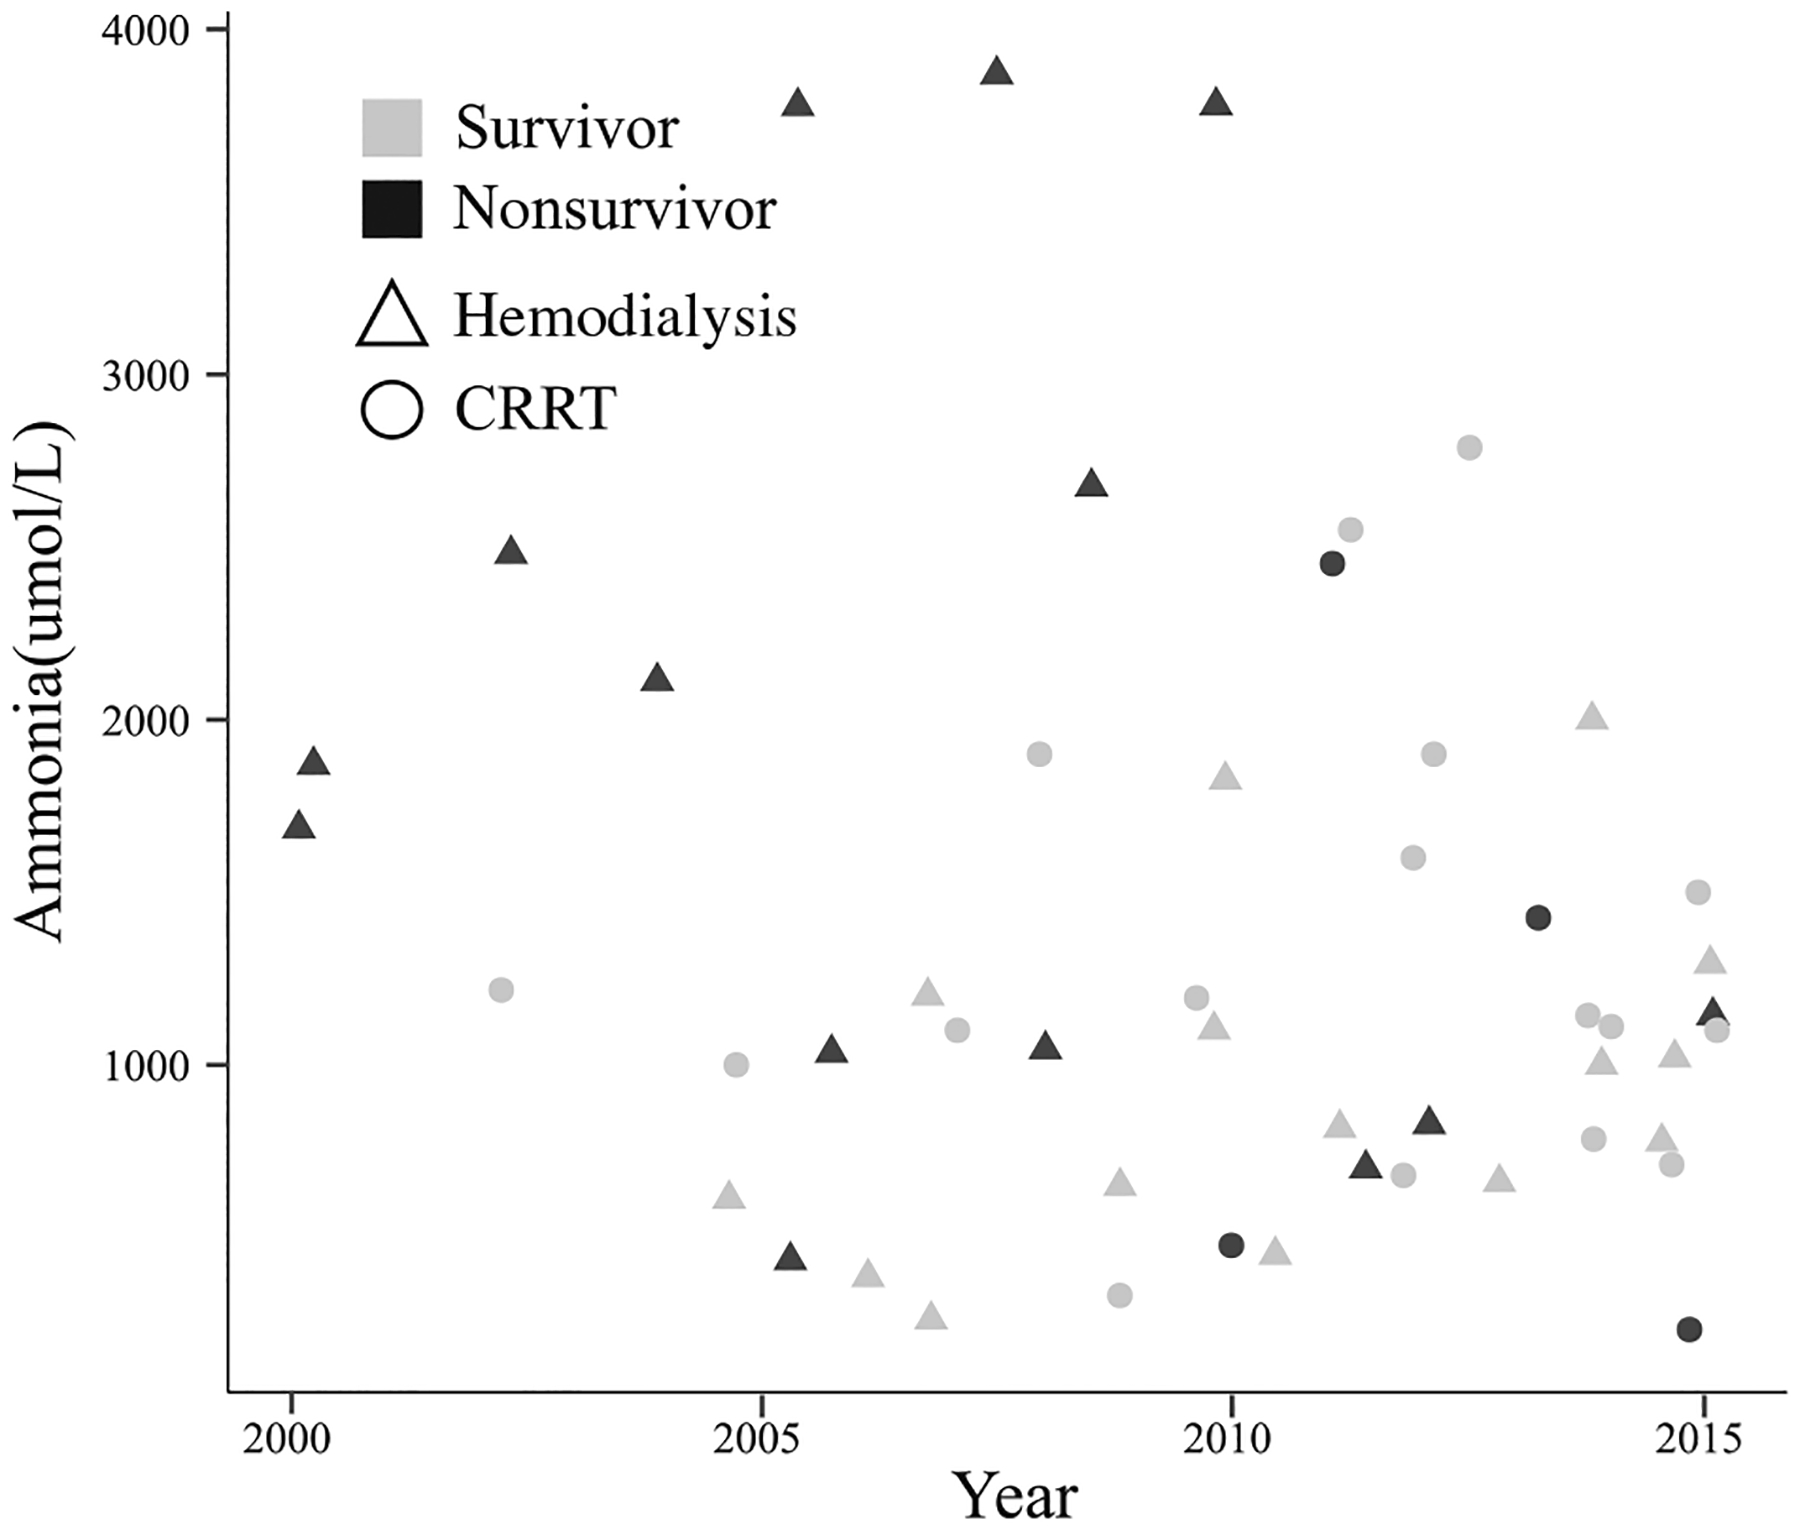
Figure 1.

Outcomes over time based on peak ammonia level and RRT modality. X-axis plots time in years. Y-axis plots peak ammonia level (μmol/L). Shapes of data points highlight individuals who received CRRT vs hemodialysis as an initial RRT modality (Δ represents those that received hemodialysis and ○ represents CRRT). Shaded shapes denote nonsurvival whereas open shapes represent those that survived.
