
Figure 3 |. EE3 motif in TRPM2 mediates TRPM2-NMDARs coupling.
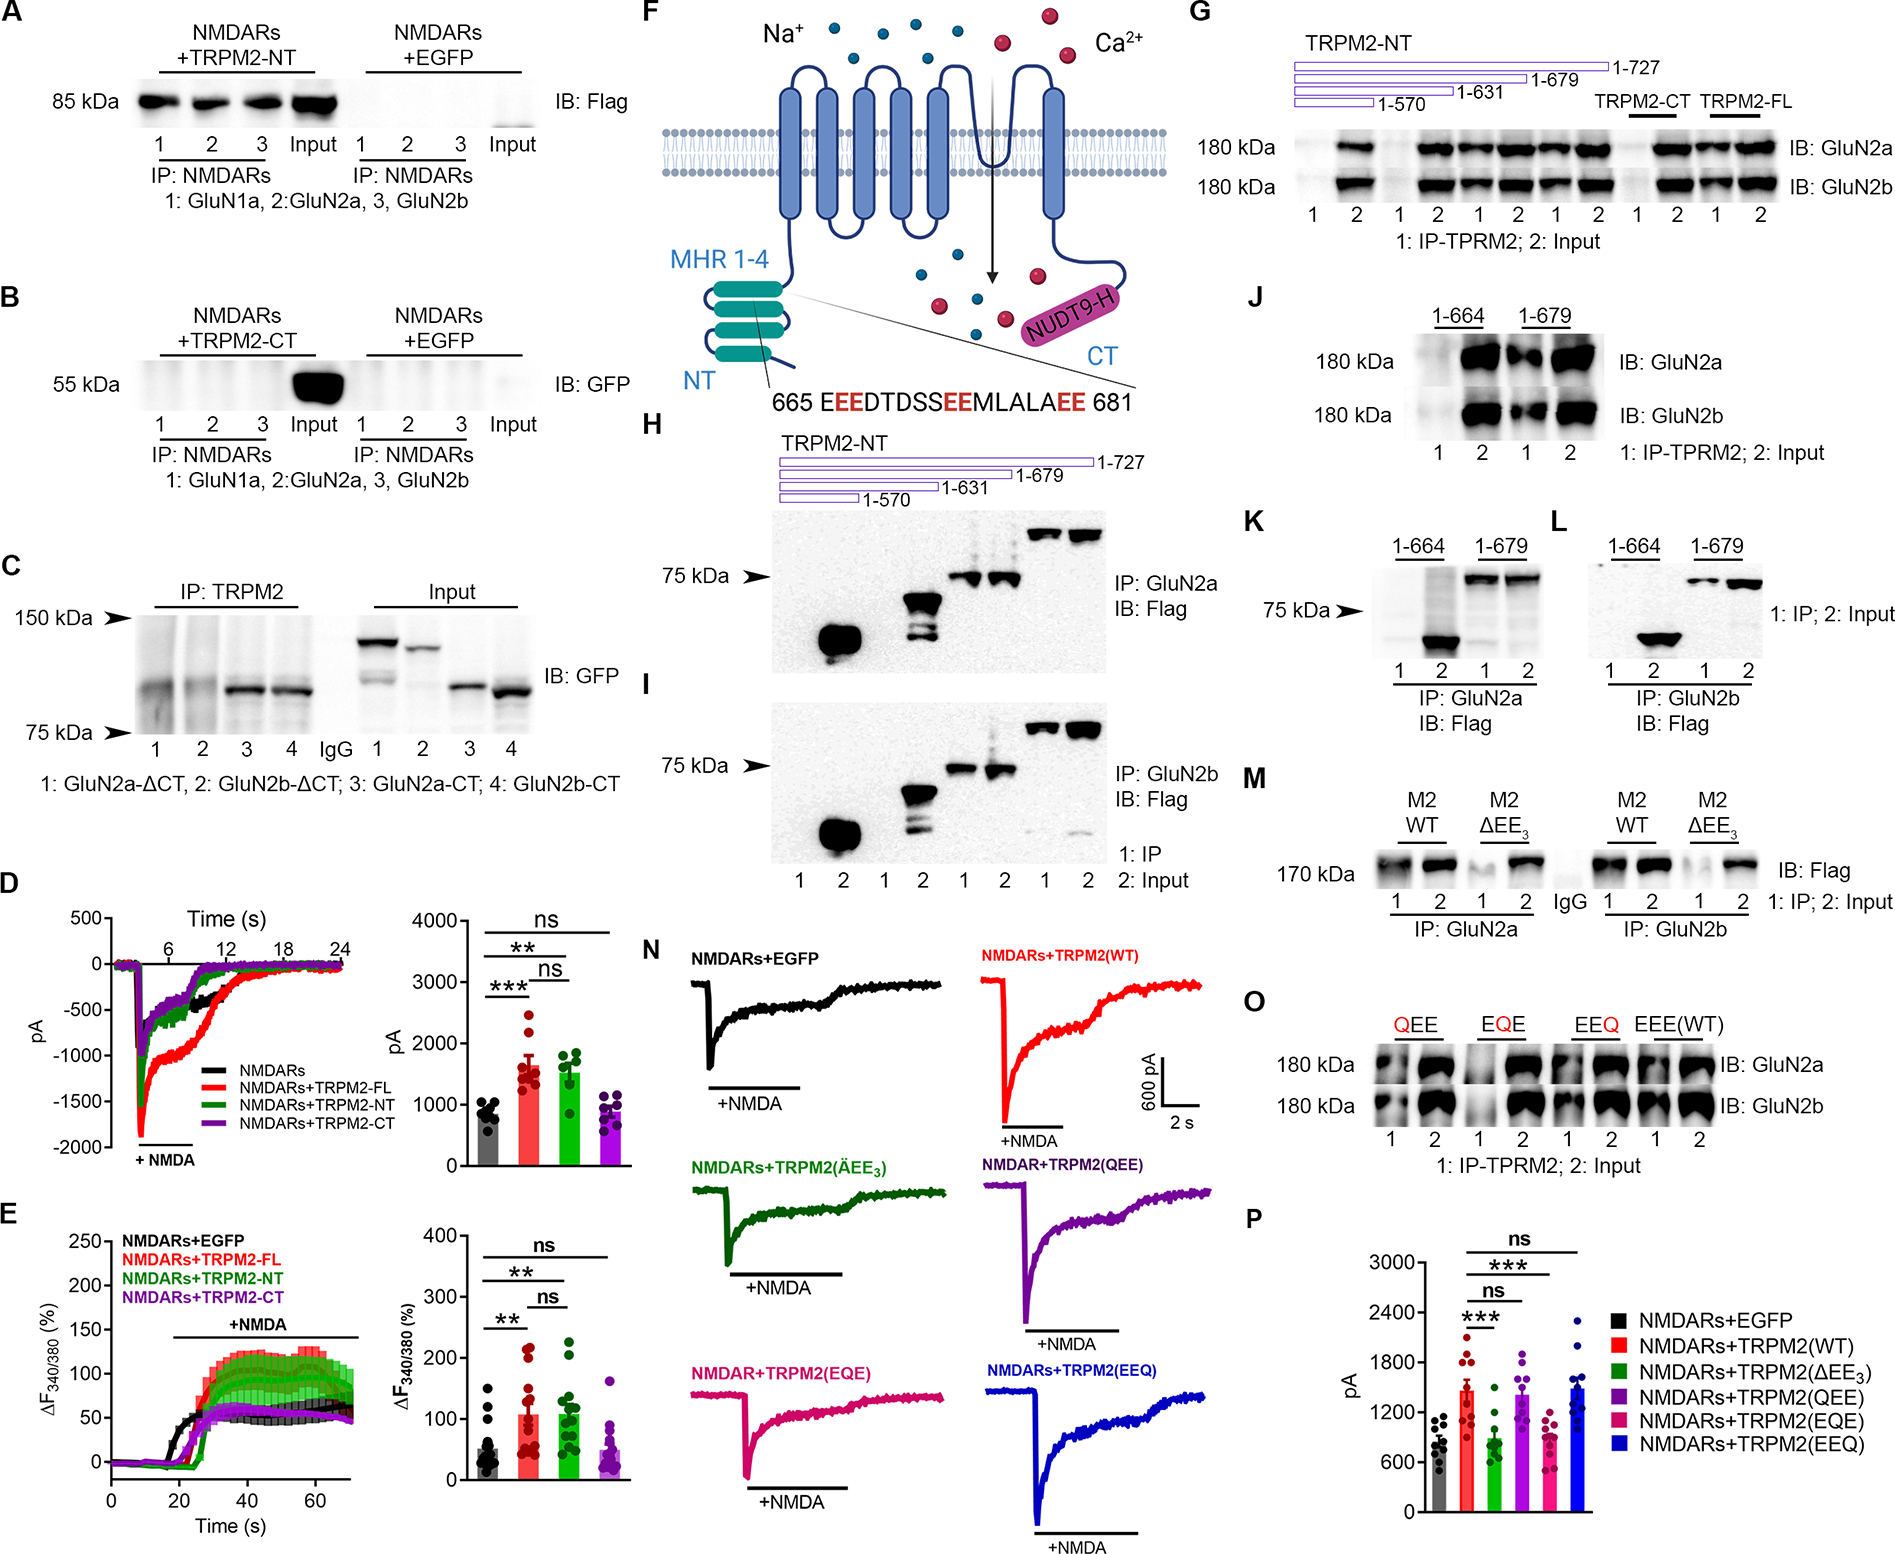
(A-B), Co-IP of N-terminal and C-terminal fragments of TRPM2 (TRPM2-NT (flag-tagged, ~85 kDa), TRPM2-CT (GFP-tagged, ~60 kDa)) with NMDARs. (A), IP using anti-NMDARs and IB with anti-Flag. (B) IP using anti-NMDARs and IB using anti-GFP.
(C), Co-IP of TRPM2 with the C-terminus of GluN2a (GluN2a-CT, 1054–1068), C-terminus deleted GluN2a (GluN2a-ΔC, 1–1053), C-terminus of GluN2b (GluN2b-CT, 1041–1691), and C-terminus deleted GluN2b (GluN2b-ΔC, 1–1047). All the constructs were GFP-tagged. IP using anti-TRPM2 and IB using anti-GFP.
(D), NMDAR current recording in HEK-293T cells transfected with NMDARs and EGFP, TRPM2-full length (FL), TRPM2-NT or TRPM2-CT (left). Average current amplitudes (n=9,8,8,8, respectively).
(E), NMDARs-mediated Ca2+ influx in HEK-293T cells transfected with NMDARs and EGFP, TRPM2-full length (FL), TRPM2-NT or TRPM2-CT (left). Averaged changes of F340/380.
(F), Membrane topology of TRPM2. The EE3 domain is located in the MHR4.
(G-L), Co-IP of Flag-tagged TRPM2 N-terminal segments with different lengths (1–570, 1–631, 1–678 and 1–727) with NMDARs. (G), IP using anti-TRPM2 (anti-GFP for TRPM2-CT) and IB using anti-GluN2a/2b. (H, I) IP using anti-GluN2a (H) or anti-GluN2b (I), and IB using anti-Flag.
(J-L), Co-IP of the TRPM2 N-tail fragments (1–664 and 1–679) with NMDARs. (J), IP using anti-TRPM2 and IB using anti-GluN2a/2b. (K, L), IP using anti-GluN2a (K) or anti-GluN2b (L), and IB using anti-Flag.
(M-P), Physical and functional coupling of TRPM2 and NMDARs through EE3 domain. (M, O), EE3 motif deletion mutant of TRPM2 (TRPM2-ΔEE3), and EE3 mutations of TRPM2, TRPM2-QEE (E666Q, E667Q), TRPM2-EQE (E673Q, E674Q), and TRPM2-EEQ (E680Q, E681Q) were co-expressed with NMDARs in HEK293T cells for co-IP. (M) IP using anti-GluN2a/b, and IB using anti-Flag. (O), IP using anti-TRPM2 and IB using anti-GluN2a/2b. (N), NMDAR current recording in HEK293T cells co-expressed with EGFP, WT-TRPM2, TRPM2-ΔEE3, TRPM2-QEE, TRPM2-EQE, and TRPM2-EEQ. (P), Mean current amplitude (n=10/group)
(ns, no statistical significance, **, p < 0.01, ***, p < 0.001; ANOVA, Bonferroni’s test; mean ± SEM)