
Fig. 2. An illustration of the improvement in functional connectivity from DRTMLE compared to the naive approach from a single simulated dataset.
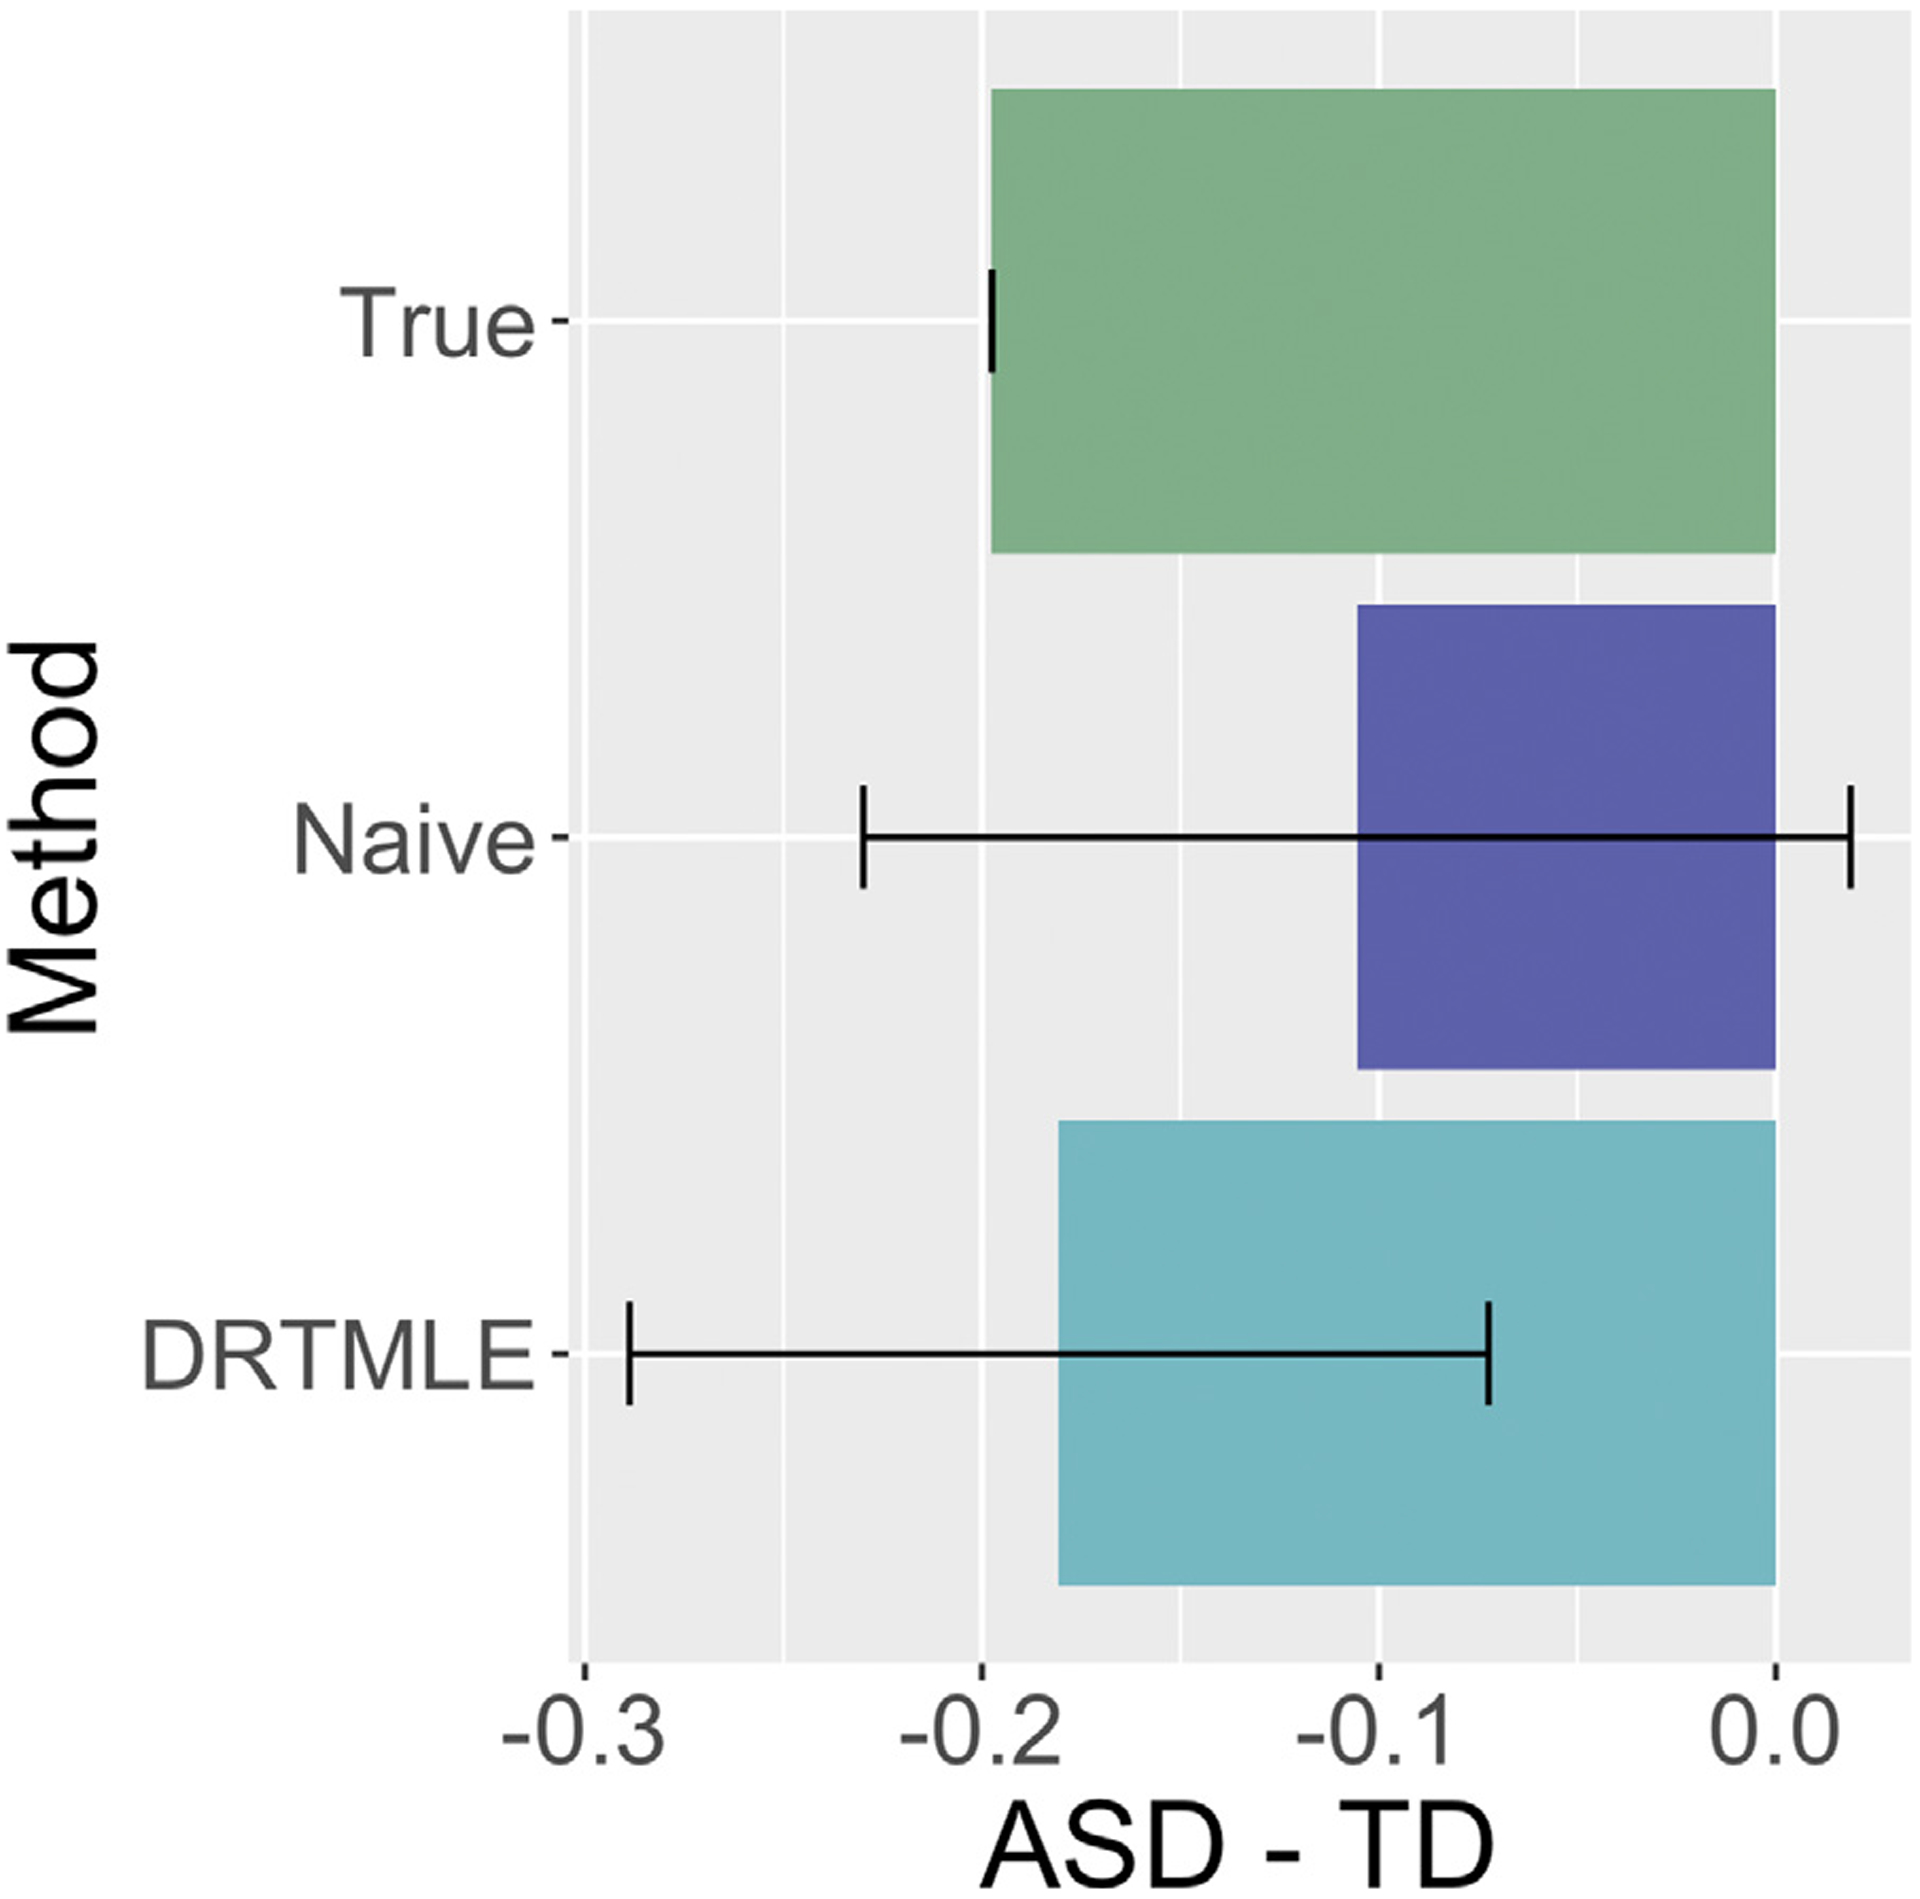
The true mean ASD-TD difference in functional connectivity is negative (green bar), with the true mean in the ASD group being negative and the true mean in the TD group being slightly positive. The estimate of the mean ASD-TD difference from the naïve approach (purple bar) is also negative but closer to zero. Additionally, the 95% confidence interval includes zero. Using DRTMLE, the deconfounded group difference (aqua bar) is closer to the truth and the 95% confidence interval does not include zero. Code to reproduce this example is available at https://github.com/mbnebel/DeconfoundedFMRI/blob/thebrisklab-main/DeconfoundGroupDifference_Tutorial.Rmd.